Combating Overfitting: Practical Strategies for Robust Machine Learning on Small Materials Science Datasets
This article provides a comprehensive guide for researchers and professionals in materials science and drug development on mitigating overfitting in machine learning models when working with limited datasets.
Combating Overfitting: Practical Strategies for Robust Machine Learning on Small Materials Science Datasets
Abstract
This article provides a comprehensive guide for researchers and professionals in materials science and drug development on mitigating overfitting in machine learning models when working with limited datasets. It explores the fundamental causes and consequences of overfitting specific to small data regimes, details practical methodologies from data-centric approaches to advanced algorithms, offers troubleshooting and optimization techniques for model refinement, and establishes frameworks for rigorous validation and benchmarking. By synthesizing current research and real-world applications, this guide aims to equip scientists with the knowledge to build more generalizable and reliable predictive models, thereby accelerating materials discovery and development.
Understanding the Small Data Dilemma: Why Overfitting Plagues Materials Science ML
Troubleshooting Guides
Why is my model performing perfectly on training data but failing on new experimental materials?
Problem: You have developed a machine learning model that achieves high accuracy on your training data but shows poor predictive performance when applied to new, unseen material compositions or structures. This is the classic sign of overfitting [1] [2].
Explanation: In materials science, overfitting occurs when your model learns not only the underlying patterns in your limited dataset but also the noise and random fluctuations specific to that data [1]. An overfitted model is excessively complex, containing more parameters than can be justified by the available data [1]. In the context of small materials data, this often happens because the model essentially "memorizes" the training examples rather than learning generalizable relationships between material descriptors and target properties [3].
Troubleshooting Steps:
- Compare Training and Validation Performance: Check if your model's accuracy or R² score on the training data is significantly higher (e.g., >15-20%) than on your validation or test set [4] [2].
- Evaluate Model Complexity: Assess if your model has too many parameters (e.g., features, network layers) relative to your number of data points. A good rule of thumb for regression is to have at least 10-15 observations per independent variable [1].
- Analyze Feature Selection: Determine if irrelevant or redundant material descriptors have been included in the model, which can cause the model to learn spurious correlations [3].
How can I detect potential overfitting when working with my small dataset?
Early detection of overfitting is crucial for developing reliable predictive models in materials science. The following table summarizes key indicators and diagnostic methods.
Table: Diagnostic Indicators of Overfitting in Small Data Regimes
| Indicator | Description | Diagnostic Method |
|---|---|---|
| Large Performance Gap | A significant difference between model performance on training data versus validation/test data [4] [2]. | Calculate and compare metrics (e.g., RMSE, MAE, R²) between training and hold-out sets. |
| High Model Variance | Model predictions change drastically when trained on different subsets of the available data [2]. | Use resampling techniques like bootstrapping or repeated cross-validation to assess prediction stability [5]. |
| Sensitivity to Noise | The model learns random fluctuations in the training data that do not represent the true structure-property relationship [1]. | Introduce small perturbations to input features and observe the magnitude of change in predictions. |
| Overly Complex Model | The model has more parameters than can be reliably estimated from the number of available observations [1]. | Compare the number of model parameters/features to the number of data samples. |
Experimental Protocols for Mitigating Overfitting
Protocol: Cross-Validation for Robust Performance Estimation
Purpose: To reliably estimate how your model will generalize to unseen material data and tune hyperparameters without requiring a separate large test set [4] [2].
Procedure:
- Data Partitioning: Randomly shuffle your dataset and split it into k equally sized folds (typically k=5 or k=10).
- Iterative Training and Validation: For each unique fold:
- Designate the current fold as the validation set.
- Designate the remaining k-1 folds as the training set.
- Train your model on the training set.
- Evaluate the model on the validation set and record the performance metric.
- Performance Calculation: Calculate the average performance across all k validation folds. This average is a more robust estimate of generalization error than a single train-test split [2].
Considerations for Materials Data: Ensure that the splitting strategy accounts for any inherent data clustering (e.g., by material family) to avoid over-optimistic estimates.
Protocol: Regularization for Controlling Model Complexity
Purpose: To prevent the model from becoming overly complex by adding a penalty to the loss function, thereby discouraging it from relying too heavily on any single feature or parameter [1] [4].
Procedure:
- Select a Regularization Technique:
- L1 (Lasso) Regularization: Adds a penalty equal to the absolute value of the magnitude of coefficients. This can drive some coefficients to zero, effectively performing feature selection [4].
- L2 (Ridge) Regularization: Adds a penalty equal to the square of the magnitude of coefficients. This shrinks coefficients but does not force them to zero [4].
- ElasticNet: Combines both L1 and L2 penalties [4].
- Hyperparameter Tuning: Use cross-validation (as described in Protocol 2.1) to find the optimal value for the regularization strength parameter (often denoted as λ or alpha). This balances the trade-off between fitting the data and keeping the model simple.
Protocol: Data Augmentation Based on Physical Models
Purpose: To artificially increase the size and diversity of your training dataset by creating new, realistic data points from existing ones, leveraging domain knowledge in materials science [3] [6].
Procedure:
- Identify Augmentable Features: Determine which material descriptors or input conditions can be varied in a physically meaningful way (e.g., elemental composition ratios, synthetic condition parameters like temperature or pressure).
- Define Transformation Rules: Establish the physical laws or empirical rules that govern how these features can be changed. For instance, use phase diagram information or known scaling laws to generate new, plausible virtual samples [6].
- Generate Synthetic Data: Apply these transformations to your original dataset to create new data points. This can be done through interpolation between known data points or by adding small, realistic noise to existing samples.
- Validate Augmented Data: Ensure that the newly generated data adheres to known physical constraints and property ranges.
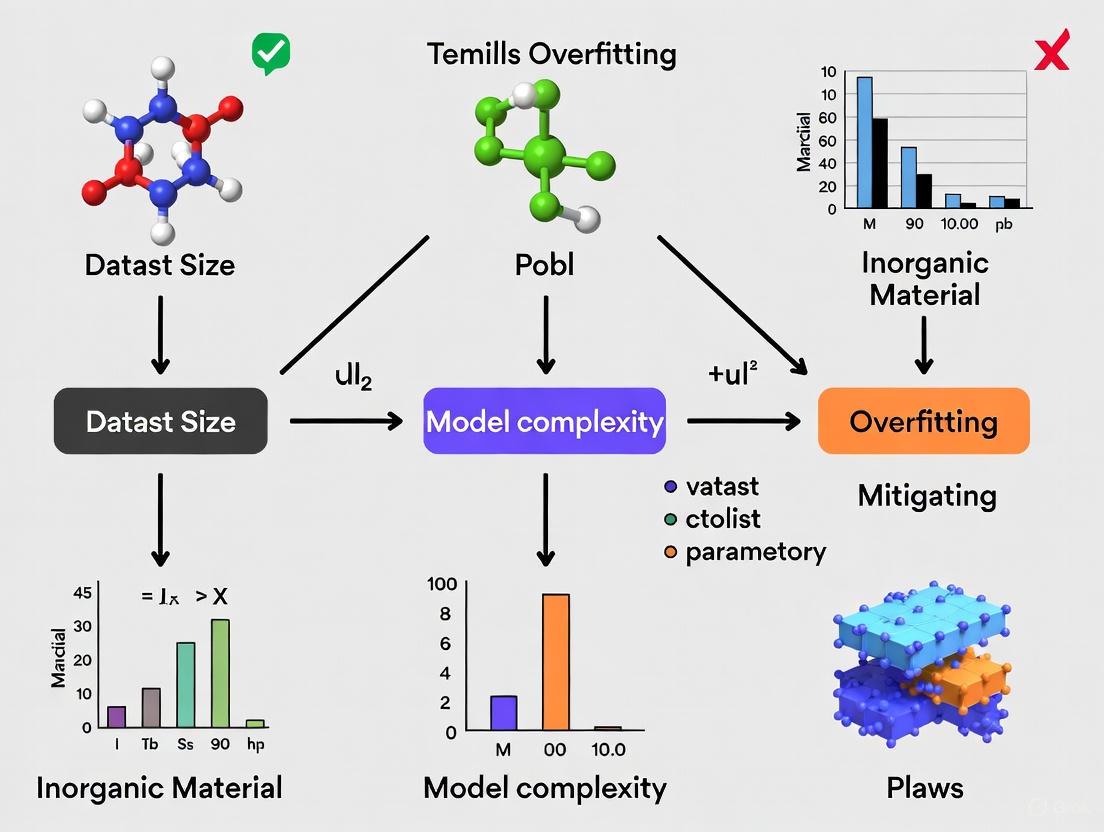
Workflow Visualization for Overfitting Management
The following diagram illustrates a logical workflow for diagnosing and mitigating overfitting when working with small datasets in materials science.
Diagram: A workflow for diagnosing and mitigating overfitting in small data regimes.
The Scientist's Toolkit: Research Reagent Solutions
This table outlines key computational and strategic "reagents" essential for combating overfitting in materials informatics projects.
Table: Essential Solutions for Managing Overfitting
| Tool / Technique | Category | Primary Function | Application Context |
|---|---|---|---|
| k-Fold Cross-Validation [4] [2] | Model Evaluation | Provides a robust estimate of model generalization error by rotating data through training and validation splits. | Essential for all model development and hyperparameter tuning with limited data. |
| L1 & L2 Regularization [1] [4] | Algorithmic Strategy | Penalizes model complexity within the algorithm itself to prevent over-reliance on specific features. | Applied during the training of linear models, neural networks, and other algorithms. |
| Physical Model-Based Data Augmentation [3] [6] | Data Strategy | Increases effective dataset size by generating new, physically plausible data points from existing ones. | Used when domain knowledge is strong but experimental data is scarce and costly to produce. |
| Transfer Learning [3] [7] [6] | Machine Learning Strategy | Leverages knowledge from a model pre-trained on a large, related dataset to boost performance on a small target dataset. | Ideal when a large dataset exists for a related property or material system, but the target dataset is small. |
| Active Learning [3] [6] | Machine Learning Strategy | Iteratively selects the most informative data points to be experimentally measured next, optimizing resource use. | Applied in high-throughput experimentation or computational screening to guide the most efficient data acquisition. |
| Feature Selection Algorithms (Filter, Wrapper, Embedded) [3] | Data Preprocessing | Identifies and retains the most relevant material descriptors, reducing dimensionality and noise. | Used when a large number of features (e.g., from DFT calculations or descriptor software) have been generated. |
Frequently Asked Questions (FAQs)
What is the fundamental difference between overfitting and underfitting?
Overfitting occurs when a model is too complex and learns both the underlying pattern and the noise in the training data, resulting in low error on training data but high error on unseen data. Underfitting occurs when a model is too simple to capture the underlying trend in the data, resulting in high error on both training and test data [1] [2]. The goal is to find a balance between the two, achieving a "well-fitted" model that generalizes well [2].
My materials dataset is unavoidably small. Which algorithms are best suited for this scenario?
With small data, preference should be given to simpler, less flexible models that are less prone to overfitting. These include:
- Linear models with strong regularization (Lasso, Ridge, ElasticNet) [4].
- Random Forests, which have built-in mechanisms to reduce variance [6].
- K-Nearest Neighbors can be effective for small, dense datasets [6].
- Support Vector Machines with linear kernels [6].
Avoid very complex models like large deep neural networks unless you are using strategies like transfer learning, where the model is first pre-trained on a large, related dataset [3] [6].
Can overfitting occur even if I don't have a large number of features?
Yes. While a high number of features relative to data points is a common cause, overfitting can also occur if the model itself is too complex (e.g., a very deep decision tree) for the amount of data available, or if it learns spurious correlations present in the small sample [1] [8]. The core issue is the ratio of model complexity to effective information in the data.
How does transfer learning help prevent overfitting in materials science?
Transfer learning addresses the small data problem at its root. Instead of training a model from scratch on your small dataset, you start with a model that has already been pre-trained on a large, general materials dataset (e.g., for predicting formation energies). This model has already learned fundamental relationships between chemical composition, structure, and properties. You then fine-tune this model on your small, specific dataset. This process requires less data to achieve high performance and significantly reduces the risk of overfitting because the model is not learning from a blank slate [3] [7] [6].
What are the ethical implications of overfitting in drug development research?
Overfitting can have serious real-world consequences. In drug development, an overfitted model might:
- Misguide Research Directions: Falsely identify a molecular compound as promising, leading to wasted resources and delays in finding effective treatments [5].
- Create False Positives: Predict non-existent efficacy or safety profiles, potentially putting clinical trial participants at risk [5].
- Erode Trust: Undermine trust in data-driven approaches and hinder the adoption of machine learning in the field. Therefore, rigorously validating models and being transparent about the risk of overfitting is an ethical imperative [5].
Technical Support Center: FAQs on Data Scarcity & Overfitting
FAQ 1: Why is overfitting a particularly critical problem in materials science research? Overfitting occurs when a model learns not only the underlying patterns in the training data but also the noise and random fluctuations, leading to poor performance on new, unseen data [9]. In materials science, where datasets are often small and high-dimensional (many features but few samples), this is a fundamental challenge [10]. An overfit model can generate misleading predictions for new material properties, such as catalytic activity or battery performance, directing experimental validation down costly and unproductive paths and ultimately hindering scientific discovery [10].
FAQ 2: What are the primary causes of data scarcity and fragmentation in scientific datasets? Data scarcity in fields like materials science stems from a combination of technical and social-institutional barriers [10]:
- High Cost of Data Generation: Experimental data, such as from clinical trials or materials testing, is often limited, costly, or difficult to access [11] [12].
- Data Fragmentation: Research organizations often manage over 100 distinct data sources, with data hoarded in proprietary or incompatible formats [10].
- Misaligned Incentives: Academic and research institutions frequently undervalue and fail to reward the tedious work of data curation, sharing, and the development of sustainable infrastructure [10].
FAQ 3: How can I detect if my model is overfitting? The primary indicator of overfitting is a significant performance gap between training and validation metrics [9]. For example, your model may show 99% accuracy on training data but only 70% on a held-out test set [9]. Monitoring the loss during training is also key; if the training loss continues to decrease while the validation loss stops improving or begins to increase, the model is likely overfitting to the training data [13].
FAQ 4: Can synthetic data truly be trusted for rigorous scientific research? Yes, when applied correctly. Synthetic data is artificially generated information that mimics the statistical properties of real-world data [12]. It has proven valuable in simulating rare events or edge cases and for privacy-preserving data sharing [12]. Its reliability depends on the quality of the generation method (e.g., GANs, VAEs, Diffusion Models) and rigorous validation to ensure it faithfully represents the physical or chemical principles of the system under study [14] [12].
Troubleshooting Guides for Small Datasets
Guide 1: Mitigating Overfitting in a Standard Machine Learning Workflow
- Problem: Model performance is excellent on training data but poor on validation/test data.
- Solution: Implement a systematic combination of techniques tailored for small datasets.
Workflow Diagram: Overfitting Mitigation Pathway
Detailed Steps:
- Simplify the Model: Begin with a less complex model architecture (e.g., fewer layers or parameters). If data is extremely limited, classical machine learning algorithms like SVM or XGBoost can outperform deep neural networks [15] [13].
- Apply Regularization: Introduce constraints to prevent the model from becoming overly complex.
- L1 (Lasso): Adds a penalty equal to the absolute value of coefficients, which can zero out less important features (feature selection) [16].
- L2 (Ridge): Adds a penalty equal to the squared value of coefficients, which shrinks all weights uniformly [16] [9].
- Dropout: For neural networks, randomly deactivate neurons during training to force robust learning [15] [13].
- Augment Data: Artificially expand your dataset using domain-specific techniques. For non-image data, this could involve synthetic data generation [15] [12].
- Use Transfer Learning: Leverage a model pre-trained on a large, general dataset (even from a different domain) and fine-tune only the final layers on your specific small dataset [15] [13]. This capitalizes on general features learned from big data.
- Rigorous Validation: Use K-fold cross-validation to make maximal use of limited data for performance estimation and apply early stopping to halt training as soon as validation performance degrades [16] [13].
Guide 2: Implementing a Synthetic Data Generation Protocol
- Problem: Insufficient real-world data for training a robust model.
- Solution: Generate high-quality synthetic data to augment the training set.
Workflow Diagram: Synthetic Data Generation and Validation
Detailed Steps:
- Select a Generation Method: Choose an algorithm based on your data type and needs.
- Generative Adversarial Networks (GANs): Use two competing neural networks (a generator and a discriminator) to produce highly realistic data. Effective for time series and image data [12] [17].
- Variational Autoencoders (VAEs): Compress and reconstruct data, good for generating structured data with controlled variations [12].
- Diffusion Models: Iteratively refine random noise to generate high-fidelity data, known for fine-grained realism [12].
- Monte Carlo Simulations: Rule-based methods that generate numerical data based on predefined distributions and probabilistic models [12].
- Generate the Data: Produce a synthetic dataset. This can be fully synthetic (created from scratch) or partially synthetic (where only sensitive fields in a real dataset are replaced) [12].
- Validate Rigorously: It is crucial to ensure the synthetic data retains the statistical properties of the real data without replicating sensitive information. Use statistical tests and, where possible, domain expert evaluation [12].
- Augment the Training Set: Combine the validated synthetic data with your original real data to create a larger, more diverse training set [17].
Quantitative Data on Techniques
Table 1: Comparison of Regularization Techniques for Small Datasets
| Technique | Mechanism | Effect on Weights | Best Use-Case in Materials Science |
|---|---|---|---|
| L1 (Lasso) [16] [9] | Adds penalty based on absolute value of coefficients. | Can zero out weights, performing feature selection. | When you have many material features (e.g., elemental descriptors) and suspect many are irrelevant. |
| L2 (Ridge) [16] [9] | Adds penalty based on squared value of coefficients. | Shrinks all weights uniformly but does not zero them. | When many features are correlated (e.g., various spectroscopic intensities). |
| Dropout [15] [13] | Randomly drops neurons during training. | Reduces reliance on any single neuron, encouraging redundancy. | In deep neural networks for predicting material properties from complex patterns. |
| Early Stopping [13] [9] | Halts training when validation performance degrades. | Prevents the model from over-optimizing on training data noise. | A universal tactic for all iterative training processes with limited data. |
Table 2: Overview of Synthetic Data Generation Methods
| Method | Key Principle | Strengths | Common Applications in Science |
|---|---|---|---|
| GANs [12] [17] | Adversarial training between generator and discriminator networks. | High-fidelity, realistic data generation. | Generating synthetic time-series data (e.g., VIX), molecular structures, sensor data. |
| VAEs [12] | Compression and probabilistic reconstruction of data. | Controlled variations; good for structured data. | Creating variations of molecular representations; generating material spectra. |
| Diffusion Models [12] | Iterative denoising from random noise. | State-of-the-art output quality and fine-grained control. | Generating high-resolution material microstructures or synthetic images. |
| Monte Carlo [12] | Random sampling based on defined probabilities. | Interpretable, rule-based; good for simulating processes. | Simulating experimental outcomes, risk modeling in drug development. |
The Scientist's Toolkit: Research Reagent Solutions
Table 3: Essential Computational Tools for Mitigating Data Scarcity
| Tool / Technique | Function | Relevance to Materials Science |
|---|---|---|
| Transfer Learning [15] [13] | Leverages knowledge from pre-trained models, reducing the need for vast labeled datasets. | Fine-tune models pre-trained on large chemical databases for specific property prediction tasks. |
| Data Augmentation [15] [12] | Artificially expands the training set by creating modified versions of existing samples. | Applying symmetries, adding noise, or using generative models to create plausible new material data points. |
| K-Fold Cross-Validation [16] [13] | Robust validation technique that maximizes the use of limited data for performance estimation. | Provides a more reliable estimate of model performance on small materials datasets than a single train-test split. |
| Feature Selection (e.g., L1) [16] [13] | Identifies and retains the most informative features, reducing dimensionality and noise. | Isolates key elemental or structural descriptors that drive a material property, improving model interpretability. |
| Foundation Models (e.g., SymTime) [14] | A pre-trained model developed on a massive, diverse dataset (including synthetic data) for a broad domain. | Can be fine-tuned for various downstream tasks like prediction and classification with minimal task-specific data. |
FAQ: Understanding and Mitigating Overfitting
What is overfitting and why is it a critical issue in research?
Overfitting occurs when a machine learning model learns the training data too well, including its noise and random fluctuations, instead of the underlying pattern. This results in a model that performs exceptionally on training data but poorly on any new, unseen data [18] [19] [20].
In the context of research, this is critical because an overfitted model cannot generalize. Its predictions and conclusions are valid only for the specific dataset it was trained on, making its findings unreliable and misleading for real-world applications or scientific discovery [21] [20].
How can I quickly diagnose if my model is overfitting?
You can diagnose overfitting by monitoring key performance metrics during your experiment. The most common indicators are [18] [22] [23]:
- Performance Discrepancy: A significant gap between high performance (e.g., accuracy) on training data and low performance on validation or test data.
- Loss Curves: Training loss continues to decrease, but validation loss begins to increase after a certain point.
- Over-Confidence: The model is highly confident in its incorrect predictions on new data, indicating it memorized details rather than understanding patterns.
For a quick check, reserve a portion of your data as a test set from the beginning. If your model's error rate is low on the training set but high on this unseen test set, it signals overfitting [19] [20].
What are the consequences of overfitting in scientific studies?
The consequences of overfitting in research extend beyond poor model performance:
- False Discoveries: Overfit models can detect subtle, spurious patterns that do not represent true underlying relationships. This can lead to high-profile false discoveries that cannot be replicated, as witnessed in fields like high-energy physics [21].
- Wasted Resources: Basing further research, experiments, or drug development on the false leads from an overfitted model wastes significant time, funding, and scientific effort [21].
- Reduced Predictive Power: The model fails in its primary purpose: to make accurate predictions on new data. This renders it useless for practical applications, such as diagnosing diseases from new medical images or predicting material properties [19] [23].
- Lack of Generalizability: The model's results are tailored to the specific sample set and cannot be applied to the broader population, undermining the scientific goal of finding general truths [21].
What is "overhyping" and how does it relate to overfitting?
Overhyping is a specific, often unintentional, form of overfitting that occurs when a researcher adjusts analysis hyperparameters to improve results for a specific dataset [21].
Hyperparameters include choices like feature selection, data pre-processing settings, or classifier parameters. When these are tuned and re-tuned based on performance on a single dataset, the model becomes tailored to that data's noise. The same hyperparameters will likely not work on a new dataset, leading to non-replicable results. This is a major barrier to replicability in scientific literature [21].
Troubleshooting Guide: Diagnosing and Fixing Overfitting
Diagnostic Protocols
Use these methodologies to systematically identify overfitting in your experiments.
Protocol 1: Monitoring Training Dynamics with k-Fold Cross-Validation
This protocol provides a robust estimate of your model's ability to generalize.
- Objective: To obtain an unbiased performance estimate and detect overfitting.
- Procedure:
- Randomly split your entire dataset into k equally sized subsets (or "folds"). Common choices are k=5 or k=10 [19].
- For each fold i (where i=1 to k):
- Set aside fold i as the validation set.
- Use the remaining k-1 folds as the training set.
- Train your model on the training set.
- Evaluate the model on the validation set and record the performance score (e.g., error rate).
- Calculate the average performance across all k validation runs. This is your cross-validation score [19] [20].
- Interpretation: A high average error on the validation folds, especially when compared to a low error on the training folds, is a clear indicator of overfitting [19].
Protocol 2: Analyzing Training and Validation Curves
This visual method helps you identify the point at which your model begins to overfit.
- Objective: To visually identify the divergence between training and validation performance.
- Procedure:
- During the model training process, record the loss (or accuracy) for both the training and validation sets at every epoch.
- Plot these values on the same graph: epochs on the x-axis and loss/accuracy on the y-axis.
- Analyze the curves for divergence [18].
- Interpretation: An ideal fit shows both curves improving together. Overfitting is indicated when the training loss continues to decrease while the validation loss stops improving and starts to increase [18].
Table: Key Metrics for Diagnosing Model Fit
| Metric | Underfitting | Good Fit | Overfitting |
|---|---|---|---|
| Training Accuracy | Low | High | Very High |
| Validation Accuracy | Low | High | Low |
| Training Loss | High | Low | Very Low |
| Validation Loss | High | Low | High |
| Primary Indicator | High Bias [22] | Balanced Bias/Variance [22] | High Variance [22] |
Mitigation Strategies
Implement these solutions to prevent and correct overfitting in your models.
Solution 1: Applying Regularization
Regularization techniques penalize model complexity to prevent the model from becoming too sensitive to noise.
- L1 Regularization (Lasso): Adds a penalty equal to the absolute value of the model's coefficients. This can shrink some coefficients to zero, effectively performing feature selection [18] [22].
- Cost Function: ( J(\theta) = \text{Loss}(\theta) + \lambda \sum{j=1}^{n} |\thetaj| ) [18]
- L2 Regularization (Ridge): Adds a penalty equal to the square of the coefficients. This forces weights to be small but rarely zero [18] [22].
- Cost Function: ( J(\theta) = \text{Loss}(\theta) + \lambda \sum{j=1}^{n} \thetaj^2 ) [18]
- Dropout (for Neural Networks): Randomly "drops out" a percentage of neurons during each training step. This prevents the network from becoming over-reliant on any single neuron and forces it to learn more robust features [23] [24].
Table: Regularization Techniques at a Glance
| Technique | Best For | Key Mechanism | Typical Hyperparameter Values |
|---|---|---|---|
| L1 (Lasso) | Feature-rich datasets where you suspect redundancy [22]. | Shrinks coefficients, can set some to zero [18]. | (\lambda): 1e-3 to 1e-6 [24] |
| L2 (Ridge) | General-purpose use; when you want to retain all features [22]. | Shrinks all coefficients evenly [18]. | (\lambda): 1e-3 to 1e-6 [24] |
| Dropout | Neural Networks of all kinds [23]. | Randomly disables neurons during training [23]. | Dropout Rate: 0.2 to 0.5 [24] |
Solution 2: Data Augmentation and Expansion
Increasing the amount and diversity of your training data is one of the most effective ways to combat overfitting [23].
- Data Augmentation: Artificially expand your dataset by creating modified versions of existing data. For materials science datasets, this could include [18] [23]:
- Image Data: Applying rotations, flips, cropping, adjusting brightness/contrast to micrograph images.
- Numerical Data: Adding small amounts of random noise to input variables (if physically meaningful).
- Synthetic Data Generation: When real data is scarce, use computer models to generate realistic, synthetic data that fills gaps in your training set [23].
Solution 3: Implementing Early Stopping
Stop the training process before the model begins to overfit.
- Objective: To halt training when performance on the validation set stops improving.
- Procedure:
- Benefit: Prevents the model from over-optimizing on the training data and saves computation time [18].
Workflow Diagrams
Diagram 1: Overfitting Diagnosis and Mitigation Workflow
Diagram 2: The Bias-Variance Tradeoff and Model Complexity
The Scientist's Toolkit: Essential Research Reagents for Mitigating Overfitting
Table: Key "Reagent Solutions" for Robust Model Development
| Reagent / Tool | Function / Purpose | Considerations for Small Datasets |
|---|---|---|
| k-Fold Cross-Validation | Robust performance estimation by partitioning data into k subsets for iterative training/validation [19] [20]. | With very small datasets, use higher k (e.g., Leave-One-Out) but be aware of unstable estimates [21]. |
| L1 & L2 Regularization | Penalizes model complexity to prevent over-reliance on specific features; L1 can perform feature selection [18] [24]. | Start with small λ values (e.g., 1e-4) to avoid introducing excessive bias (underfitting). |
| Data Augmentation | Artificially expands training set by creating plausible variations of existing data [18] [23]. | Critically important for small datasets. Ensure transformations are physically meaningful for your materials science domain. |
| Early Stopping | Halts training when validation performance degrades, preventing the model from learning noise [18] [20]. | Set a low patience parameter to stop quickly, as small datasets can overfit in fewer epochs. |
| Pre-trained Models (Transfer Learning) | Leverages features learned from large, general datasets as a starting point for a new task [23]. | Highly effective when domain-related pre-trained models exist; requires less data to achieve good performance. |
| Simplified Model Architectures | Reduces the number of model parameters (e.g., layers, neurons), lowering capacity to memorize [18] [23]. | Prefer simpler models (linear models, shallow trees) as a baseline before trying complex architectures. |
The Bias-Variance Tradeoff Explained in the Context of Materials Datasets
In materials science, the journey from data to discovery is often paved with small, expensive-to-acquire datasets. Whether designing new alloys or optimizing drug formulations, researchers must build predictive models that are both accurate and reliable. The bias-variance tradeoff is a fundamental machine learning concept that describes the tension between a model's simplicity and its complexity, directly impacting its ability to generalize from training data to new, unseen data. For materials scientists, mastering this tradeoff is not merely academic; it is essential for mitigating overfitting and ensuring that models yield trustworthy, actionable insights. This guide provides targeted troubleshooting advice to help you navigate these challenges.
FAQs & Troubleshooting Guides
FAQ 1: What exactly are bias and variance, and how do they manifest in materials data?
Question: I often hear that my model might have "high bias" or "high variance." What do these terms mean in the practical context of predicting material properties?
Answer: Bias and variance are two sources of error that contribute to a model's prediction inaccuracy. In simple terms, bias is the error from overly simplistic assumptions, while variance is the error from excessive sensitivity to the training data's noise.
Symptoms and Diagnosis Table:
| Error Type | What It Is | Common Symptoms in Materials Data | Visual Model Behavior |
|---|---|---|---|
| High Bias (Underfitting) | The model is too simple to capture underlying patterns (e.g., using a linear model for a complex relationship) [25] [26]. | High error on both training and validation/test data. Poor performance even on data it was trained on [25]. | A straight line fit to data with a clear non-linear trend (e.g., predicting polymer strength from chain length). |
| High Variance (Overfitting) | The model is too complex and learns the noise in the training data, not just the true signal [27] [28]. | Low error on training data, but high error on validation/test data [25] [26]. The model is not generalizable. | A complex, "wiggly" curve that passes through every training data point but fails on new data (e.g., predicting perovskite efficiency). |
The total error of a model can be decomposed into three parts: Bias² + Variance + Irreducible Error. The goal is to find the model complexity that minimizes the sum of bias and variance errors [27] [26].
FAQ 2: Why is the bias-variance tradeoff particularly critical for small materials datasets?
Question: My dataset has only ~100 samples due to high experimental costs. Why is overfitting a more severe threat in this scenario?
Answer: Smaller datasets are less likely to accurately represent the full complexity and diversity of the population you are studying. This makes them inherently more prone to overfitting, as a complex model can easily "memorize" the limited samples instead of learning a generalizable rule [29] [3]. In such cases, the model's performance on its training data will be deceptively high, but it will fail catastrophically when presented with new data from a slightly different synthesis condition or composition [29].
Experimental Protocol: Diagnosing the Tradeoff with Learning Curves
- Partition Data: Split your data into training and validation sets (e.g., 80/20).
- Train Incrementally: Train your model on progressively larger subsets of the training data (e.g., 10%, 20%, ..., 100%).
- Record Metrics: For each subset, calculate and record the model's error on both the training subset and the validation set.
- Plot and Analyze: Generate a plot with the dataset size on the x-axis and error on the y-axis.
- High Bias Indication: Both training and validation errors converge to a high value.
- High Variance Indication: A large gap exists between a low training error and a high validation error.
FAQ 3: What are the most effective strategies to control for high variance and overfitting?
Question: My model shows a big gap between training and test error. What concrete steps can I take to reduce variance?
Answer: Mitigating high variance involves simplifying the model or reducing its capacity to learn noise. Here are proven methodologies:
Troubleshooting Guide Table:
| Strategy | Methodology | Application Context in Materials Science |
|---|---|---|
| Regularization [25] | Add a penalty to the model's loss function for large coefficients. L1 (Lasso) can force some feature weights to zero, performing feature selection. L2 (Ridge) shrinks all weights. | Use L1 regularization to identify the most critical elemental descriptors (e.g., which atomic radii or electronegativities truly drive catalytic activity). |
| Cross-Validation [29] | Use techniques like repeated k-fold cross-validation to evaluate model performance more reliably and guide hyperparameter tuning. | In a study with n=146 samples, using 5-fold cross-validation provides a more realistic performance estimate than a single train-test split [29]. |
| Ensemble Methods [25] | Combine predictions from multiple models (e.g., Random Forests via bagging) to average out their individual variances. | Predict the thermal stability of a new polymer composite by aggregating predictions from hundreds of decision trees, each trained on a slightly different data bootstrap. |
| Hyperparameter Tuning [29] [25] | Systematically search for optimal model settings (e.g., regularization strength, tree depth) that balance bias and variance. | Use a grid search to find the optimal polynomial degree for relating processing temperature to battery material conductivity, avoiding overly complex functions. |
FAQ 4: How can I address high bias and underfitting in my models?
Question: My model is performing poorly on all data. How can I reduce its bias and capture more complex relationships?
Answer: High bias indicates your model is not powerful enough for the problem. To address it:
- Increase Model Complexity: Move from linear models to more complex algorithms like Support Vector Machines with non-linear kernels, ensemble methods (e.g., Gradient Boosting), or carefully designed neural networks [28].
- Feature Engineering: Create new, more informative descriptors. This is where domain knowledge is critical.
- Protocol: Use tools like Dragon or RDKit to generate a vast pool of structural descriptors [3]. Then, employ feature selection methods (filter, wrapper, or embedded) to identify the most predictive subset. Alternatively, create domain-knowledge-based descriptors (e.g., combining atomic radius and electronegativity into a new feature).
- Reduce Regularization: If you are applying strong regularization, slightly reducing its strength can allow the model to fit the data more closely.
FAQ 5: How can I build trust in my model's predictions, especially when it's complex?
Question: My neural network model is accurate but acts as a "black box." How can I explain its predictions to my colleagues?
Answer: The field of Explainable AI (XAI) addresses this exact issue. For complex models, you can use post-hoc explanation techniques to understand which features the model deemed most important for a specific prediction [30].
Protocol: Using SHAP for Model Interpretation
- Train Model: Train your best-performing complex model (e.g., a gradient boosting machine or neural network).
- Calculate SHAP Values: Use the SHAP (SHapley Additive exPlanations) Python library. For a given prediction, SHAP calculates the contribution of each feature to the final output.
- Visualize: Create a SHAP summary plot or force plot to see the global and local importance of your material descriptors (e.g., it might reveal that valence electron count is the dominant factor in predicting alloy hardness). This bridges the gap between a black-box model and actionable scientific insight [30].
The Scientist's Toolkit: Key Research Reagents & Computational Solutions
- Table 1: Essential "Reagents" for Robust Materials Informatics
| Tool / Solution | Type | Primary Function | Example in Materials Research |
|---|---|---|---|
| Cross-Validation (e.g., k-Fold) | Statistical Method | Provides a robust estimate of model performance and mitigates overfitting by rotating training/validation splits [29]. | Evaluating the true predictive power of a model for drug solubility with limited experimental data points. |
| L1 / L2 Regularization | Algorithmic Technique | Shrinks model coefficients to prevent overcomplexity and can perform automatic feature selection (L1) [25]. | Identifying the key process parameters (e.g., annealing time, temperature) that affect semiconductor crystal quality. |
| Random Forest / XGBoost | Ensemble Algorithm | Reduces prediction variance by averaging the results of multiple models (e.g., decision trees) [25]. | Predicting the bandgap of novel perovskite compounds based on elemental and structural features. |
| SHAP / LIME | Explainable AI (XAI) Library | Explains individual predictions from any complex model, increasing trust and interpretability [30]. | Understanding why a model predicts a specific polymer formulation will have high tensile strength. |
| Training History Analysis | Diagnostic Tool | Monitoring loss curves helps detect overfitting (diverging train/validation loss) and can signal the optimal stopping point [31]. | Stopping the training of a deep learning model on spectral data before it starts to memorize noise. |
Troubleshooting Guides
Why is my model's performance excellent on training data but poor on new experimental data?
Problem: This is a classic sign of overfitting, where a model memorizes the noise and specific patterns in the training data instead of learning the underlying generalizable relationships [9]. This is particularly common in materials science where datasets are small and feature-rich [3] [8].
Solution:
- Action 1: Simplify your model. Reduce model complexity by using models with fewer parameters. For example, choose a linear model with regularization over a deep neural network, or limit the depth of a decision tree [13] [32] [9].
- Action 2: Apply regularization. Add L1 (Lasso) or L2 (Ridge) regularization to your model's loss function. This penalizes overly complex models and discourages the model from relying too heavily on any single feature [32] [9].
- Action 3: Implement rigorous validation. Use k-fold cross-validation (e.g., 5-fold) to validate your model. This ensures the model is evaluated on different data splits, providing a more reliable estimate of its performance on unseen data [13] [33] [9].
How can I build a reliable predictive model with only 50 data points?
Problem: With a very small dataset, there is a high risk of the model learning spurious correlations that do not generalize, leading to overfitting [3] [8].
Solution:
- Action 1: Employ feature selection. Reduce the number of input descriptors by using feature selection methods (e.g., filtered, wrapped, or embedded methods) to retain only the most relevant features. This reduces the dimensionality and helps the model focus on meaningful signals [3] [13] [32].
- Action 2: Utilize data augmentation. Artificially expand your dataset by creating modified versions of existing samples. For non-image data, this could involve adding small amounts of noise or generating synthetic data points based on domain knowledge [13] [32].
- Action 3: Leverage transfer learning. Use a pre-trained model from a related materials domain or a large public database and fine-tune its last few layers on your small dataset. This allows you to benefit from general features learned on a larger corpus of data [3] [13].
My active learning loop seems to be stuck, not finding better materials. What should I check?
Problem: The sampling strategy in your active learning cycle may be inefficient, or the surrogate model itself may be overfitted, leading to poor decisions about which experiment to perform next [34] [35].
Solution:
- Action 1: Verify your utility function. In active learning, the utility (or acquisition) function dictates which sample to query next. If using an uncertainty-based method, ensure that the model's uncertainty estimates are well-calibrated. Consider switching to or hybridizing with a diversity-based strategy to better explore the search space [34] [35].
- Action 2: Re-assess the surrogate model. An overfitted surrogate model will provide misleading predictions and uncertainties. Incorporate regularization and cross-validation into the training of the surrogate model itself to ensure its robustness [34] [35].
- Action 3: Incorporate hybrid strategies. Instead of relying on a single principle (e.g., only uncertainty), use hybrid strategies that balance exploration (diversity) and exploitation (uncertainty or expected improvement), as these have been shown to perform well in early stages of data acquisition [35].
Frequently Asked Questions (FAQs)
What are the most effective methods to prevent overfitting in small datasets?
The most effective methods combine data-centric, model-centric, and strategic approaches [3] [13] [9]:
- Model-Centric Techniques:
- Regularization (L1/L2): Adds a penalty to the model's loss function to discourage complexity [32] [9].
- Dropout: Randomly ignores a subset of neurons during training in neural networks to prevent co-adaptation [13] [32].
- Early Stopping: Halts training when performance on a validation set stops improving, preventing the model from over-optimizing to the training noise [13] [32] [9].
- Data-Centric Techniques:
- Strategic Techniques:
How do I know if my materials model is overfitted?
You can detect overfitting by looking for the following indicators [33] [9]:
- A significant performance gap: The model's performance (e.g., R², MAE) is much better on the training data than on the validation or test data. This is the most telling sign.
- Unrealistically high training accuracy: The model achieves near-perfect performance on the training set, which is often implausible for real-world materials data.
- Validation with an independent test set: The model performs poorly on a completely hold-out dataset that was never used during training or validation. A robust validation protocol is essential for this [33].
Can using domain knowledge really help with small data problems?
Yes, integrating domain knowledge is a powerful strategy to combat overfitting in small data regimes [3] [36]. It helps in several ways:
- Informed Feature Engineering: Domain knowledge can guide the creation of physically meaningful descriptors, which allows the model to focus on relevant patterns instead of spurious correlations [3].
- Constraining Models: Physical principles can be embedded into the model's architecture or loss function, ensuring that predictions are physically plausible and reducing the hypothesis space the model needs to explore [36].
- Guiding Prior Distributions: In Bayesian methods, domain knowledge can be used to set informative prior distributions, which is particularly valuable when data is scarce [36].
Is cross-validation sufficient to ensure my model will generalize?
While necessary, cross-validation alone is not always sufficient. Its effectiveness depends on correct implementation [33]:
- Preventing Data Leakage: It is critical that information from the validation set does not leak into the training process during feature selection or hyperparameter tuning. The validation set must remain a truly independent simulation of unseen data [33].
- Representative Splits: The data splits must be representative of the overall data distribution. For materials data with inherent groupings (e.g., from different synthesis batches), stratified or group-based cross-validation may be necessary.
- Final Hold-out Test: A best practice is to still reserve a final, completely untouched test set for a final evaluation of the model's generalization after the entire model development and cross-validation cycle is complete [33].
Table 1: Benchmarking of Active Learning Strategies for Small-Sample Regression in Materials Science [35]
| Strategy Category | Example Methods | Performance in Early Stages (Data-Scarce) | Performance in Later Stages (Data-Rich) |
|---|---|---|---|
| Uncertainty-Driven | LCMD, Tree-based-R | Clearly outperforms random sampling | Converges with other methods |
| Diversity-Hybrid | RD-GS | Clearly outperforms random sampling | Converges with other methods |
| Geometry-Only | GSx, EGAL | Performance closer to random sampling | Converges with other methods |
| Random Sampling | (Baseline) | (Baseline for comparison) | (Baseline for comparison) |
Table 2: Common Overfitting Detection Metrics and Their Interpretation
| Metric | Comparison | Indicator of Overfitting |
|---|---|---|
| MAE / RMSE | Training value << Validation value | Yes |
| R² Score | Training value >> Validation value | Yes |
| Loss Function | Training loss << Validation loss | Yes |
Experimental Protocols & Workflows
Protocol: Rigorous Validation for Small Materials Datasets
Objective: To reliably detect overfitting and estimate model performance on unseen data when the total dataset is small (N < 200). Materials: A single, curated materials dataset with features and target property. Methodology:
- Initial Split: First, split the data into a hold-out test set (e.g., 20%) and a working set (80%). The hold-out test set is put aside and not used until the very end.
- Cross-Validation: On the working set, perform k-fold cross-validation (k=5 or 10 is common). This involves: a. Shuffling the working set and splitting it into k equal-sized folds. b. For each unique fold as the validation set, train the model on the remaining k-1 folds. c. Calculate the performance metrics on the validation fold.
- Hyperparameter Tuning: Use the cross-validation process to tune model hyperparameters. The average performance across the k folds guides the selection of the best parameters.
- Final Assessment: Train the final model on the entire working set using the best-found hyperparameters. Evaluate this model once on the untouched hold-out test set to obtain an unbiased estimate of its generalization error [33].
Protocol: Implementing an Active Learning Cycle
Objective: To efficiently guide experiments or computations towards materials with desired properties, minimizing the number of required samples. Materials: A large pool of unlabeled candidate materials (e.g., from combinatorial space) and a method to label them (computation or experiment). Methodology:
- Initialization: Start with a small, randomly selected set of labeled data (L).
- Model Training: Train a surrogate model (e.g., a regression model) on the current labeled set L.
- Query Selection: Use a utility function (e.g., an uncertainty-based or hybrid strategy) to select the most informative sample(s) from the unlabeled pool (U).
- Labeling & Update: Obtain the label (property value) for the selected sample(s) through experiment or computation. Add this newly labeled data to L and remove it from U.
- Iteration: Repeat steps 2-4 until a stopping criterion is met (e.g., a performance target is achieved or the experimental budget is exhausted) [34] [35].
Diagram 1: Active learning workflow for targeted materials design.
Diagram 2: Rigorous validation protocol to prevent overfitting.
The Scientist's Toolkit: Research Reagent Solutions
Table 3: Essential Computational & Experimental Tools for Small-Data Materials Research
| Tool / Solution | Function | Relevance to Small Data & Overfitting |
|---|---|---|
| AutoML Frameworks | Automates the process of model selection and hyperparameter tuning [35]. | Reduces manual tuning bias and efficiently finds a robust model architecture, saving time and resources. |
| L1/L2 Regularization | A technique that adds a penalty to the loss function to constrain model complexity [32] [9]. | Directly prevents overfitting by discouraging the model from relying too heavily on any single feature. |
| Monte Carlo Dropout | A variant of dropout used during inference to estimate model uncertainty [35]. | Provides uncertainty estimates for predictions, which is crucial for active learning and assessing model reliability. |
| Data Augmentation Tools | Software for generating synthetic data points from existing data (e.g., via transformations or noise addition) [13]. | Artificially increases the effective size of the training set, helping models learn more generalizable patterns. |
| Domain Knowledge Descriptors | Physically meaningful features generated from scientific principles [3] [36]. | Guides the model to learn correct underlying relationships, reducing the risk of learning spurious correlations. |
A Practical Toolkit: Data, Algorithmic, and Strategic Solutions for Small Datasets
Frequently Asked Questions (FAQs)
Q1: How can generative models like TVAE and CTGAN help mitigate overfitting in my materials science research with small datasets? These models address overfitting by tackling the root cause: limited data. They learn the underlying distribution and complex relationships within your original, small dataset of material properties. By generating high-quality, synthetic data that mirrors the statistical characteristics of the real data, they artificially expand your training set. This provides the machine learning model with a more comprehensive feature space to learn from, preventing it from memorizing noise and specific patterns that do not generalize. In practice, training predictive models on a mix of real and synthetic data has been shown to significantly improve performance on unseen test data, a key indicator of reduced overfitting [37].
Q2: My dataset has a mix of continuous (e.g., yield strength) and categorical (e.g., crystal structure) data. Which model is most suitable? Both CTGAN and TVAE were specifically designed to handle this challenge. They use advanced techniques to model mixed data types simultaneously. CTGAN uses a conditional generator and training-by-sampling to effectively deal with imbalanced categorical columns [38]. TVAE uses a variational autoencoder architecture that also incorporates special treatments for mixed data types through its data transformation layers [39].
Q3: What are the key steps to validate that my synthetic materials data is high-quality and useful? Validation is a multi-step process:
- Statistical Similarity: Compare the distributions (via histograms) and basic statistics (mean, standard deviation, min, max) of the synthetic and real features. The synthetic data should recreate these closely [37].
- Relationship Preservation: Check that correlations between variables (e.g., between defect depth and residual strength) are maintained in the synthetic data. Pearson correlation coefficient analysis is a common method for this [37].
- Physical Plausibility: Manually inspect the synthetic data for physically impossible values (e.g., a defect depth greater than the wall thickness) and filter them out [37].
- Utility Test: The ultimate test is to use the synthetic data in your downstream task. Train your predictive model on an augmented dataset (real + synthetic) and evaluate its performance on a held-out set of real data. An improvement in metrics like R² signifies successful augmentation [37].
Q4: I am concerned about the computational cost. How do these models compare in terms of training time and resources? As deep learning models, TVAE and CTGAN can be computationally intensive. The training time depends on your dataset size, the number of epochs, and your hardware.
- CUDA Support: Both models in the SDV implementation support using CUDA for faster training on GPUs, which can significantly speed up the process [39].
- Epochs: You can control the training duration via the
epochsparameter. Starting with the default (e.g., 300) and monitoring the loss values can help you find a good balance between time and quality [39]. - Comparative Resource Use: The specific computational demands of TVAE versus CTGAN can vary based on the dataset and hyperparameters. It is advisable to run pilot tests on a subset of your data.
Q5: After training a synthesizer, the sampled data contains some unrealistic outliers. How can I fix this? This is a common issue. You can employ a two-pronged approach:
- Post-sampling Filtering: Implement a rule-based filter to remove synthetic samples that violate known physical constraints (e.g., a synthetic material with a negative density or a tensile strength outside a possible range) [37].
- Adjust Sampling Parameters: Some synthesizers offer parameters like
enforce_min_max_valuesandenforce_rounding, which can help ensure generated numerical values stay within the observed boundaries of the real data [39].
Troubleshooting Guides
Problem: The machine learning model trained on synthetic data shows no improvement or performs worse. This indicates that the synthetic data may not be capturing the true patterns of your materials data.
| Possible Cause | Diagnostic Steps | Solution |
|---|---|---|
| Poor quality synthetic data. The generative model did not learn the real data distribution effectively. | Check statistical similarity and correlation preservation between real and synthetic data [37]. | Increase the number of epochs during training [39]. Experiment with different models (TVAE vs. CTGAN) [37]. Adjust the generative model's hyperparameters (e.g., batch_size, learning_rate) [39]. |
| Data preprocessing errors. The real data was not in the correct format for the synthesizer. | Ensure continuous data is represented as floats and discrete data as integers or strings. Check for and handle any missing values before training [40]. | Preprocess the real data to meet the model's requirements. For the SDV library, this is often handled automatically, but it's a critical step when using the standalone CTGAN library [40]. |
| Excessive synthetic data. Using too much synthetic data can drown out the signal from the limited real data. | Experiment with different ratios of real to synthetic data in the training set (e.g., 50%-50%, 70%-30%). | Reduce the amount of synthetic data used for augmentation. The goal is to complement the real data, not replace it entirely. |
Problem: The training process for the generative model is unstable or fails to converge. This is often observed as highly fluctuating or non-decreasing loss values.
| Possible Cause | Diagnostic Steps | Solution |
|---|---|---|
| Inappropriate learning rate. A learning rate that is too high can prevent convergence. | Enable verbose training to monitor the loss and see if it oscillates wildly [39]. |
Decrease the learning rate. For CTGAN, a typical learning rate is 2e-4 [41]. |
| Issues with the training data. The dataset may be too small or have severe imbalances. | Analyze your dataset for severe class imbalances in categorical columns. | For CTGAN, the conditional generator and training-by-sampling are designed to handle this. For TVAE, ensure your dataset is as balanced as possible [38]. |
| Model-specific instability. GANs like CTGAN are known to be tricky to train. | Use the get_loss_values() method to track the loss and see if it is converging [39]. |
Consider using the TVAE model, which may offer more stable training due to its variational autoencoder foundation compared to the adversarial training of GANs [39] [38]. Train for more epochs. |
Experimental Protocols & Data
Summary of Model Performance in a Materials Study The following table summarizes the quantitative results from a study that used TVAE, CopulaGAN, and CTGAN to augment data for predicting the residual strength of corroded pipelines. The performance was measured by the improvement in the R² score of a LightGBM model on a held-out test set [37].
Table 1: Comparison of Data Augmentation Models on a Materials Dataset
| Generative Model | Base Model | Key Improvement (R² Score Increase) |
|---|---|---|
| TVAE | LightGBM | +3.12% |
| CopulaGAN | LightGBM | +4.46% |
| CTGAN | LightGBM | +3.60% |
Source: Adapted from "Advancing LightGBM with data augmentation for predicting the residual strength of corroded pipelines" [37].
Detailed Methodology for a Materials Data Augmentation Experiment
Data Collection and Preprocessing:
- Gather the limited original materials dataset (e.g., from experiments or finite element simulations).
- Preprocess the data: handle missing values, and ensure continuous features are represented as floats and categorical features as strings or integers. The SDV library can automate much of this [40].
- Clean the data by removing any physically impossible outliers (e.g., a defect depth larger than the wall thickness) [37].
Synthesizer Training:
- Initialize Model: Choose a synthesizer (e.g.,
TVAESynthesizerorCTGAN) and initialize it with the dataset's metadata and desired parameters. - Set Parameters: Common parameters include
epochs(number of training cycles, start with 300-500),verbose=Trueto monitor progress, andcuda=Trueto use GPU acceleration if available [39]. - Fit Model: Train the synthesizer on the entire preprocessed real dataset using the
.fit(data)method [39].
- Initialize Model: Choose a synthesizer (e.g.,
Synthetic Data Generation and Validation:
- Sample Data: Use the
.sample(num_rows)method to generate a synthetic dataset. The size can be a multiple of your original dataset (e.g., 5x or 10x) [39]. - Validate Quality:
- Compare the distributions of individual features (e.g., wall thickness, yield strength) between real and synthetic data using histograms [37].
- Compare the Pearson correlation matrices to ensure relationships between variables are preserved [37].
- Filter out any synthetic samples that violate domain knowledge.
- Sample Data: Use the
Downstream Task Evaluation:
- Create an augmented training set by combining the original data with a portion of the validated synthetic data.
- Train a downstream machine learning model (e.g., a regressor to predict material strength) on this augmented set.
- Evaluate the model's performance on a completely held-out test set that contains only real, unseen data. Compare metrics like R² or Mean Absolute Error against a model trained only on the original small dataset [37].
The Scientist's Toolkit: Research Reagent Solutions
Table 2: Essential Components for a Generative Modeling Experiment
| Item / Solution | Function in the Experiment |
|---|---|
| Original Materials Dataset | The small, high-value dataset of real measurements (e.g., from mechanical tests, characterizations). Serves as the ground truth for training the generative model. |
| SDV (Synthetic Data Vault) Library | The primary software toolkit providing user-friendly, high-level APIs for implementing TVAESynthesizer and CTGANSynthesizer, handling data transformation and modeling [39] [40]. |
| Computational Resources (GPU) | A graphics processing unit to accelerate the training of deep learning-based synthesizers via CUDA, significantly reducing computation time [39]. |
| Validation Framework (e.g., Jupyter Notebook with Pandas, Matplotlib) | A environment for analyzing and comparing the statistical properties (distributions, correlations) of the real and synthetic datasets to ensure quality [37]. |
| Downstream Predictive Model (e.g., LightGBM, Random Forest) | A machine learning model used for the ultimate scientific task (e.g., predicting strength). Its performance on a test set is the final measure of the synthetic data's utility [37]. |
Workflow Visualization
Below is a workflow diagram illustrating the complete pipeline for leveraging generative models to combat overfitting in materials science.
Synthetic Data Generation and Validation Workflow
Frequently Asked Questions (FAQs)
FAQ 1: What is the fundamental limitation of the standard SMOTE algorithm that can lead to overfitting in small materials datasets?
The standard SMOTE algorithm generates new synthetic samples through simple linear interpolation between a minority class instance and one of its k-nearest neighbors [42]. This mechanism has two key limitations that can lead to overfitting, particularly in small datasets common in materials science:
- Density Over-amplification: In high-density regions of minority class samples, SMOTE may produce an excessive number of synthetic instances, causing the model to overfit to these localized areas [42].
- Distributional Distortion: The linearly interpolated samples may not conform to the original underlying data distribution, potentially creating a distorted representation of the minority class and generating unrealistic or noisy samples that cross into the majority class space [42] [43].
FAQ 2: Which SMOTE variants are specifically designed to mitigate overfitting by generating more realistic synthetic samples?
Several advanced variants modify the data generation mechanism to create samples that better preserve the original data distribution, thereby reducing the risk of overfitting [42].
- ISMOTE (Improved SMOTE): This method adaptively expands the synthetic sample generation space. Instead of generating samples only between two original samples, it creates new samples around them using a random quantity based on the Euclidean distance. This alleviates distortions in local data distribution and density [42].
- Borderline-SMOTE: This technique focuses oversampling on the "borderline" minority instances—those that are closer to the decision boundary and thus more critical for classification. This avoids generating samples in already well-defined minority regions [44] [45].
- K-Means SMOTE: This algorithm first clusters the data using K-means. It then targets oversampling to clusters with a high proportion of minority classes and a sparse distribution of minority samples, ensuring generated samples align with the natural data structure [44].
- Counterfactual SMOTE: A novel approach that combines SMOTE with a counterfactual generation framework, intrinsically performing oversampling near the decision boundary but within a "safe region" to generate informative yet non-noisy minority samples [46].
FAQ 3: Should the test set be resampled when using SMOTE in an experimental protocol?
No. The test set must never be resampled [47]. The core purpose of a test set is to provide an unbiased evaluation of the model's performance on real-world, imbalanced data. Resampling the test set would create a unrealistic scenario and invalidate performance metrics. Resampling techniques like SMOTE should be applied only to the training data, and any associated hyperparameter tuning (like the k for nearest neighbors) should be performed using a separate validation set derived from the training data [47].
FAQ 4: How does data complexity, such as noise and class overlap, affect the choice of a resampling method?
Data complexity factors like noise (minority samples in majority regions) and overlap (where classes cannot be linearly separated) significantly aggravate the class imbalance problem [48] [45] [49].
- Problem: Standard SMOTE can amplify noise by generating synthetic samples around these outlier points. In regions of high class overlap, it can create more ambiguity by generating synthetic minority samples in the majority class domain, a problem known as overgeneralization [45].
- Solutions:
- Use Hybrid Methods: Integrate SMOTE with data cleaning techniques. For example, SMOTE-ENN and SMOTE-Tomek Links apply SMOTE first and then use undersampling to remove noisy or overlapping samples from both classes [48] [45].
- Select Robust Variants: Choose variants like Safe-Level-SMOTE or Borderline-SMOTE that are designed to avoid generating samples in unsafe, noisy regions [44].
Troubleshooting Guides
Issue 1: Model performance degrades after applying SMOTE, showing high accuracy on the majority class but poor recall on the minority class.
This is a classic sign of overgeneralization or the introduction of noise by the resampling method [45].
- Possible Causes:
- SMOTE is generating synthetic samples in the majority class region.
- The dataset has a high degree of noise or class overlap.
- The parameter
kfor nearest neighbors is too small, leading to overfitting to local clusters, or too large, introducing irrelevant neighbors.
- Recommended Solutions:
- Apply a Filter: Use a hybrid method like SMOTE-ENN to remove noisy samples after oversampling [45].
- Switch Variants: Implement Borderline-SMOTE or Safe-Level-SMOTE to focus on safer, more informative regions for sample generation [44].
- Tune Hyperparameters: Systematically optimize the
kparameter using cross-validation on the training set. Consider using a largerkfor sparse datasets.
Issue 2: The synthetic data generated by SMOTE does not appear to reflect the true distribution of the minority class in my materials data.
This concern is valid, as theoretical analysis shows SMOTE-generated patterns do not necessarily conform to the original minority class distribution [43].
- Possible Causes:
- The linear interpolation of SMOTE is too simplistic for the potentially complex, non-linear manifold of your materials data.
- The minority class may consist of several sub-concepts or "small disjuncts" that SMOTE fails to capture.
- Recommended Solutions:
- Use Cluster-based SMOTE: Apply K-Means SMOTE, which first identifies natural clusters and then performs oversampling within them, better preserving the overall data structure [44].
- Explore Advanced Variants: Consider ISMOTE, which expands the generation space to create a more realistic distribution [42], or FLEX-SMOTE, which is designed to flexibly adjust to different minority class distributions [50].
The following table summarizes key performance metrics from recent studies comparing various SMOTE variants. These metrics are crucial for evaluating the effectiveness of these techniques in mitigating overfitting and improving model robustness.
Table 1: Comparative Performance of SMOTE Variants on Public Datasets
| Algorithm | Key Improvement | Reported Performance Improvement (Relative) | Best Suited For |
|---|---|---|---|
| ISMOTE [42] | Expands sample generation space to alleviate density distortion. | F1-score: +13.07%G-mean: +16.55%AUC: +7.94% | Datasets where standard SMOTE causes overfitting in high-density regions. |
| Borderline-SMOTE [44] | Focuses oversampling on borderline minority instances. | (Widely reported to improve precision and recall at the decision boundary) | Problems where the boundary between classes is critical. |
| K-Means SMOTE [44] | Uses clustering to oversample in appropriate regions. | (Improves data representation by considering cluster structure) | Datasets with inherent sub-concepts within the minority class. |
| SMOTE-ENN [45] | Combines oversampling with cleaning of both classes. | (Effective at improving G-mean and AUC in complex, noisy data) | Complex datasets with significant noise or class overlap. |
Experimental Protocols for Key SMOTE Variants
Protocol 1: Implementing and Evaluating the ISMOTE Algorithm
This protocol is based on the improved SMOTE algorithm designed to generate a more realistic data distribution [42].
- Input: Original imbalanced training set ( U = UL \cup UM ), where ( UL ) is the minority class and ( UM ) is the majority class.
- Synthetic Sample Generation:
- For a given minority instance ( xi ), select one of its k-nearest neighbors, ( x{zi} ).
- Generate a base sample on the line segment between ( xi ) and ( x{zi} ).
- Calculate the Euclidean distance ( d ) between ( xi ) and ( x{zi} ).
- Multiply ( d ) by a random number ( \delta ) between 0 and 1 to get a random quantity ( r = \delta \times d ).
- The new synthetic sample ( x{new} ) is generated by adding or subtracting this random quantity ( r ) from the base sample's position vector, ensuring it is created around the line connecting ( xi ) and ( x_{zi} ).
- Output: A balanced training set with synthetic minority samples that better reflect the expanded sample space.
- Validation: Always validate the model, trained on the resampled data, on a pristine, untouched test set that reflects the original imbalance [47].
Protocol 2: A Standard Workflow for Applying SMOTE Variants in Materials Science
The diagram below illustrates a robust experimental workflow for applying SMOTE variants in a materials science research project, incorporating best practices to mitigate overfitting.
Diagram 1: SMOTE Application Workflow
The Scientist's Toolkit: Research Reagent Solutions
Table 2: Essential Computational Tools and Algorithms
| Item / Algorithm | Function / Purpose | Key Application in Materials Science |
|---|---|---|
| Standard SMOTE [42] | Generates synthetic minority samples via linear interpolation to balance class distribution. | Baseline oversampling for initial attempts to handle imbalance in datasets like catalyst screening [51]. |
| ISMOTE [42] | Expands the sample generation space to create more realistic distributions and reduce overfitting. | For advanced applications where standard SMOTE leads to distribution distortion, e.g., in polymer property prediction. |
| Borderline-SMOTE [45] | Selectively oversamples minority instances near the decision boundary. | Improving model accuracy in critical classification tasks, such as distinguishing between high/low-performance materials. |
| K-Means SMOTE [44] | Uses clustering to identify sparse minority regions for targeted oversampling. | Handling complex materials data with multiple distinct sub-classes (e.g., different crystal structure phases). |
| SMOTE-ENN [45] | A hybrid method that oversamples the minority class and then cleans both classes by removing noisy samples. | Deploying on noisy experimental data with significant class overlap to create a clearer decision boundary. |
| XGBoost Classifier [51] | A powerful ensemble learning algorithm often used with resampled data for final prediction. | Building high-performance prediction models for tasks like mechanical property prediction or catalyst design [51]. |
Frequently Asked Questions
1. My model performs well on training data but poorly on validation data. What is happening? This is a classic sign of overfitting. Your model has likely learned the noise and specific details of your training data, rather than the underlying pattern that generalizes to new data. This is a common risk with complex, non-linear models like Gradient Boosted Trees or large Neural Networks, especially when the training dataset is small [52].
2. I have a very small dataset. Should I even consider using non-linear models? Yes, but with extreme caution and strategic modifications. While small datasets increase the risk of overfitting for non-linear models, their ability to capture complex, non-linear relationships can still be crucial [53] [3]. The key is to use strong regularization, prefer models with built-in feature selection, and employ techniques like data augmentation or transfer learning to effectively "increase" your data size [3] [54].
3. Is there a trade-off between model interpretability and performance? Not necessarily. A common misconception is that only black-box models can achieve high accuracy. Recent research shows that a new generation of Generalized Additive Models (GAMs) can provide high performance while remaining fully interpretable. These models capture non-linear relationships for each feature in an additive manner, making them both powerful and transparent [55].
4. How can I identify if my dataset contains non-linear relationships? A good first step is to use non-linear feature selection methods. Linear methods often fail to identify these patterns. If non-linear methods consistently select a different set of features as important, it is a strong indicator that your data has non-linear dependencies that a linear model would miss [53].
Troubleshooting Guides
Problem: Diagnosing High Bias (Underfitting) or High Variance (Overfitting)
Symptoms and Diagnosis:
| High Bias (Underfitting) | High Variance (Overfitting) | |
|---|---|---|
| Training Error | High | Very Low |
| Validation Error | High | High |
| Model Behavior | Oversimplifies the problem, fails to capture underlying trends [25]. | Memorizes the training data, including its noise [25]. |
| Common in | Linear models on complex problems [25]. | Complex models (deep trees, NNs) on small datasets [52] [25]. |
Mitigation Strategies:
- If your model has High Bias (Underfitting):
- Increase Model Complexity: Switch from a linear model to a non-linear one like Random Forest or a shallow Neural Network.
- Feature Engineering: Add more informative features or create new features through combination (e.g., using SISSO in materials science [3]).
- Reduce Regularization: Lower the strength of L1 or L2 regularization [25].
- If your model has High Variance (Overfitting):
- Gather More Data: This is one of the most effective solutions [56]. If impossible, use data augmentation techniques (e.g., bootstrapping, SMOTE, generative models [54]).
- Increase Regularization: Tune hyperparameters like L2 regularization in regression,
max_depthin trees, or dropout in Neural Networks [52] [25]. - Simplify the Model: Use a simpler algorithm (e.g., Linear Model instead of NN) or reduce the number of parameters [25].
- Use Ensemble Methods: Bagging (e.g., Random Forest) reduces variance by averaging multiple models [57] [25].
Problem: Model Selection for Small Materials Science Datasets
Background: Materials science often faces the "small data" dilemma, where acquiring data is costly and time-consuming [3]. This makes the choice between linear and non-linear models critical.
Recommended Protocol:
The following workflow outlines a systematic approach to model selection for small datasets:
- Start Simple: Begin with a linear model (e.g., Linear or Logistic Regression) paired with a non-linear feature selection method [53]. This helps identify if non-linear relationships exist without the risk of overfitting from a complex model.
- Evaluate: If the linear model's performance is adequate and no strong non-linear relationships are found, it is the safest choice for your small dataset.
- Gradually Increase Complexity: If you suspect non-linearities, move to a more flexible but interpretable model like a Generalized Additive Model (GAM) [55]. GAMs offer a good balance for small data.
- Employ Advanced, Regularized Models: If performance is still insufficient, use strongly regularized non-linear models. For tree-based methods like XGBoost or Random Forest, tune hyperparameters aggressively:
- Leverage Specialized Strategies: Consider machine learning strategies designed for small data:
Problem: Tuning the Bias-Variance Tradeoff in Non-Linear Models
Background: The goal is to find the sweet spot where your model is complex enough to learn the true pattern (low bias) but not so complex that it learns the noise (high variance) [25].
Mitigation Strategies:
The diagram below illustrates how model complexity affects error and guides the tuning goal:
- Apply Regularization:
- Use Ensemble Methods:
- Implement Early Stopping: For iterative models like Gradient Boosting or Neural Networks, halt training when performance on a validation set stops improving. This prevents the model from overfitting to the training data over many iterations [52].
Key Research Reagent Solutions
| Category | Solution | Function in Experiment |
|---|---|---|
| Model Algorithms | Generalized Additive Models (GAMs) | Provides a fully interpretable model that can capture non-linear patterns without becoming a black-box [55]. |
| Random Forest | A robust, ensemble method that reduces variance and is less prone to overfitting than a single decision tree [57] [52]. | |
| XGBoost / LightGBM | High-performance boosting algorithms effective for tabular data; require tuning of regularization parameters (lambda, max_depth) for small datasets [57]. | |
| Feature Selection | Non-linear Filter Methods (e.g., MI) | Identifies relevant features without assuming a linear relationship, crucial for uncovering complex dependencies [53] [58]. |
| Data Augmentation | SMOTE / Bootstrapping | Generates synthetic samples to augment small datasets, helping to reduce overfitting and improve model generalization [54]. |
| Advanced Strategies | Transfer Learning / Domain Adaptation | Leverages knowledge from a source domain (e.g., a large public dataset) to improve model performance in a target domain with small data [54]. |
| Active Learning | Optimizes data collection by iteratively selecting the most valuable data points to label, maximizing model performance with minimal data [3]. |
Frequently Asked Questions (FAQs)
Q1: My materials dataset is very small and my model is overfitting. Why would combining models with voting or stacking help?
A1: Ensemble methods like voting and stacking combat overfitting by leveraging the "wisdom of crowds" principle. On a small dataset, a single complex model can easily memorize noise and specific data points. Voting ensembles combine predictions from multiple, diverse base models (e.g., SVM, Decision Tree, Logistic Regression), smoothing out individual errors and reducing overall variance [59] [60]. Stacking takes this further by using a meta-model to intelligently learn how to best combine these base predictions, which captures broader patterns and ignores spurious correlations present in small datasets [61].
Q2: I'm trying to implement a Voting Classifier for a binary classification problem on my spectral data. Should I use 'hard' or 'soft' voting?
A2: The choice depends on the nature of your models and your goal.
- Hard Voting: The final prediction is based on the majority vote (mode) of the predictions from all base models. Use this when your base classifiers are well-calibrated and you want a simple, robust combination method [59].
- Soft Voting: The final prediction is based on the argmax of the sum of predicted probabilities. This is often more accurate than hard voting if all your base classifiers can output reliable probability estimates, as it gives more weight to more confident predictions [59] [61].
Q3: When building a stacking ensemble, what is a common mistake that can lead to data leakage and over-optimistic results?
A3: A critical mistake is using the same data to train both your base models (level-0) and your meta-model (level-1). This causes data leakage and severe overfitting. The correct protocol is to use k-fold cross-validation on the training set. For each fold, the base models are trained on a portion of the data, and their predictions on the held-out fold become the input features for the meta-model's training data. This ensures the meta-model learns from out-of-sample predictions, which is crucial for generalization [61].
Q4: For a stacking ensemble on a small dataset, what is a good choice for the meta-learner and why?
A4: On small datasets, it is advisable to use a simple, linear model as your meta-learner. Logistic Regression (for classification) or Linear Regression (for regression) are excellent choices [59] [62]. These models have a low tendency to overfit themselves. Their role is not to re-learn complex patterns from the data, but to learn the optimal linear combination of the base models' predictions. Using a complex model like a deep neural network as the meta-learner on a small dataset would likely defeat the purpose and lead to overfitting.
Q5: How can I assess whether my ensemble model is truly more stable and robust than a single model?
A5: Stability and robustness can be evaluated by examining the variance in performance across multiple runs or data splits.
- Protocol: Perform multiple train-test splits (or use repeated k-fold cross-validation) and train both your single best model and your ensemble model each time.
- Metric: Calculate the mean accuracy (or other relevant metric) and, more importantly, the standard deviation of that metric across all runs. A more stable and robust ensemble will demonstrate a higher mean accuracy and a lower standard deviation compared to a single model, indicating its performance is consistently good and less sensitive to variations in the training data [60].
Troubleshooting Guides
Problem: My Voting Ensemble is performing no better than my best individual base model.
Potential Causes and Solutions:
- Cause 1: Lack of Model Diversity. The ensemble's power comes from combining diverse, uncorrelated errors. If all your base models are very similar (e.g., all tree-based models) or make the same mistakes, the ensemble cannot correct them.
- Cause 2: One Strong Model Dominating. If one base model is significantly more accurate than the others, the voting outcome may simply reflect this single model's prediction.
- Solution: For soft voting, ensure all models output well-calibrated probabilities. Alternatively, consider moving to a stacking ensemble, where the meta-model can learn to assign appropriate weights to each base model, potentially down-weighting the strong but occasionally erroneous model in favor of a consensus [62] [61].
Problem: My Stacking Ensemble is overfitting on my small materials science dataset.
Potential Causes and Solutions:
- Cause 1: Overly Complex Meta-Model. The meta-learner (level-1 model) is too complex for the amount of meta-features (base model predictions) you have.
- Cause 2: Data Leakage in the Stacking Process. The meta-model was trained on base model predictions that were not truly out-of-sample.
- Solution: Rigorously implement the k-fold cross-validation protocol for generating the training data for the meta-model, as described in FAQ A3. Most modern libraries, like scikit-learn, handle this automatically when you use
cvparameter in theStackingClassifier[61].
- Solution: Rigorously implement the k-fold cross-validation protocol for generating the training data for the meta-model, as described in FAQ A3. Most modern libraries, like scikit-learn, handle this automatically when you use
- Cause 3: Too Many Base Models. With a small dataset, having a large number of base models can provide too many inputs (features) for the meta-model, leading to overfitting.
- Solution: Perform a pruning step. Select only the 3-5 best and most diverse base models for the final stacking ensemble. This reduces the dimensionality of the problem for the meta-learner [60].
The following table summarizes a typical experimental setup for comparing single models against voting and stacking ensembles, using a framework like scikit-learn. The quantitative results are illustrative of the performance gains often observed.
Table 1: Ensemble Method Performance on a Small Classification Dataset
| Model / Ensemble Type | Key Hyperparameters | Training Accuracy | Test Accuracy | Notes / Key to Performance |
|---|---|---|---|---|
| Single: Decision Tree | max_depth=10 |
~99% | 91.7% | Prone to overfitting (high variance). |
| Single: Logistic Regression | C=1.0, penalty='l2' |
93.5% | 93.2% | Stable but with high bias on complex patterns. |
| Single: Support Vector Machine | kernel='rbf', C=1.0 |
95.1% | 94.8% | Good performance but computationally expensive. |
| Voting (Hard) | voting='hard' |
96.3% | 95.5% | Outperforms the best single model (SVM) by leveraging collective decision. |
| Voting (Soft) | voting='soft' |
96.8% | 96.1% | Further improvement by using model confidence. |
| Stacking | final_estimator=LogisticRegression() |
97.5% | 97.5% | Highest performance; meta-model optimally blends base predictions. |
Detailed Experimental Protocol:
- Data Preparation: Split your small materials dataset (e.g., spectral data, composition data) into a stratified 80% training and 20% hold-out test set. Always apply any necessary feature scaling (e.g., StandardScaler) after the split to avoid data leakage.
- Base Model Training: On the training set, define and tune 3-5 diverse base models. Example models include:
- A
DecisionTreeClassifier(pruned to avoid overfitting). - A
LogisticRegressionmodel. - An
SVC(withprobability=Truefor soft voting).
- A
- Ensemble Construction:
- Voting: Use
VotingClassifierfrom scikit-learn. Specify the estimators and the voting method (hardorsoft). Fit it on the training data. - Stacking: Use
StackingClassifier. Specify the same base estimators and a simple, linearfinal_estimator(meta-model). Use thecvparameter (e.g.,cv=5) to ensure the meta-model is trained on out-of-fold predictions from the base models, which is crucial for preventing overfitting [59] [63].
- Voting: Use
- Evaluation: Predict on the held-out test set and compare the accuracy, precision, recall, and F1-score of all models. For stability assessment, run this process with multiple random seeds and compare the standard deviation of the test scores.
Ensemble Learning Workflow Visualization
The following diagram illustrates the logical flow and data movement in a stacking ensemble, highlighting the crucial k-fold cross-validation step used to prevent overfitting.
Stacking Ensemble Workflow with k-Fold CV
The Scientist's Toolkit: Essential Research Reagents for Ensemble Experiments
Table 2: Key Software Tools and Their Functions for Ensemble Learning
| Item / Tool | Function / Purpose in Ensemble Learning |
|---|---|
| Scikit-learn Library | The primary Python library providing implementations for VotingClassifier, StackingClassifier, and all base models (LR, SVM, DT) and meta-models [59] [63]. |
| XGBoost / LightGBM | Advanced, highly optimized gradient boosting frameworks that can be used as powerful base models within a stacking ensemble to capture complex, non-linear relationships in data [59] [61]. |
| Pandas & NumPy | Foundational Python libraries for data manipulation, handling, and representation of the feature matrices and prediction arrays required for building ensembles. |
| Matplotlib / Seaborn | Visualization libraries used to plot learning curves, compare model performance, and visualize decision boundaries to diagnose overfitting and ensemble efficacy. |
| k-Fold Cross-Validation | A critical methodological "tool" (e.g., sklearn.model_selection.KFold) used to generate out-of-fold predictions for training the meta-model in stacking, thereby preventing data leakage [61]. |
FAQs
1. Why should I use physically meaningful descriptors instead of "black-box" features for my small dataset? Physically meaningful descriptors, which are grounded in chemical or physical principles, provide several key advantages when working with small datasets commonly found in materials science and drug development. They enhance model interpretability, allowing you to understand the relationship between input features and the target property. Furthermore, they act as a regularizing prior, reducing the risk of overfitting by constraining the model to plausible physical relationships, which is crucial when data is limited [64]. Models built with such descriptors also tend to generalize better to unseen data, as they capture fundamental material characteristics rather than spurious correlations that can occur in small data contexts [65].
2. My model is overfitting on a small dataset. What strategies can I use beyond just collecting more data? Collecting more data is often expensive or impractical. Several machine learning strategies can mitigate overfitting in small-data regimes:
- Integrate Domain Knowledge as Constraints: Incorporate physical laws or known behavioral constraints (e.g., requiring a model to predict positive values for a property like energy) directly into the model's loss function during training. This guides the model toward physically plausible solutions [65].
- Utilize Transfer Learning: Leverage models pre-trained on large, general materials databases (even for different properties) and fine-tune them on your small, specific dataset. This transfers general materials knowledge to your task [3] [6].
- Employ Active Learning: An iterative process where the model itself identifies which new data points would be most informative to acquire next. This optimizes the experimental budget by prioritizing measurements that will most improve the model [3].
- Apply Data Augmentation Based on Physical Models: Use physics-based simulations or rules to generate synthetic, but physically plausible, data points to expand your training set [6].
3. What are the key criteria for selecting good descriptors? High-quality descriptors for material properties should satisfy the MENA criteria [64]:
- Meaningful: The descriptor should be linked to a known physical or chemical principle, making it interpretable to a domain expert.
- Efficient: The computational cost of calculating the descriptor should be significantly lower than directly computing the target property via high-fidelity simulation.
- Small Number: The total number of descriptors should be relatively small to avoid the curse of dimensionality, which is particularly severe for small datasets.
- Accurate: The set of descriptors must contain sufficient information for the model to make accurate predictions of the target property.
Troubleshooting Guides
Problem: Poor Model Performance and Suspected Overfitting
Symptoms:
- Excellent performance on training data but poor performance on validation/test data.
- Model predictions that violate known physical laws or domain knowledge (e.g., predicting negative mass).
Investigation & Resolution:
| Step | Action | Details and Rationale |
|---|---|---|
| 1 | Diagnose the Issue | Plot learning curves (training vs. validation error across training steps). A growing gap indicates overfitting. Check for physically implausible predictions [65]. |
| 2 | Review Your Descriptors | Evaluate your feature set against the MENA criteria [64]. A large number of non-meaningful descriptors is a common culprit. Use feature selection (e.g., wrapped methods) or dimensionality reduction (e.g., PCA) to reduce redundancy [3]. |
| 3 | Incorporate Domain Knowledge | Add domain-knowledge constraints to your model's loss function. For example, penalize predictions that result in negative values for properties known to be strictly positive [65]. |
| 4 | Switch to a Simpler or Inherently Interpretable Model | For very small datasets, complex models like deep neural networks are prone to overfitting. Consider using simpler, inherently interpretable models like linear regression with Lasso regularization, decision trees, or Gaussian process regression [66] [6]. |
| 5 | Apply Advanced Small-Data Strategies | If simpler models are insufficient, employ strategies like transfer learning to initialize your model with pre-trained weights from a larger, related dataset [6]. |
Problem: Model Predictions Are Not Interpretable
Symptoms:
- Inability to understand which input features are driving a model's prediction.
- Lack of trust in the model's recommendations for new experiments.
Investigation & Resolution:
| Step | Action | Details and Rationale |
|---|---|---|
| 1 | Prioritize Intrinsically Interpretable Models | Start with models that are interpretable by design, such as linear models (where coefficients indicate feature importance) or small decision trees (which can be visualized) [66]. |
| 2 | Generate Descriptors from Domain Knowledge | Instead of relying on abstract features, create descriptors based on empirical formulas or physical principles. This directly embeds causality and interpretability [3]. |
| 3 | Use Post-hoc Interpretation Methods | Apply model-agnostic interpretation methods to understand complex models. Use global methods like Partial Dependence Plots (PDP) to understand overall feature effects, and local methods like LIME or SHAP to explain individual predictions [66]. |
| 4 | Validate with Domain Experts | Present the model's logic and key descriptors to a domain expert. Their validation is the ultimate test for whether the model's interpretability is meaningful and aligns with established science [66]. |
Experimental Protocols
Protocol 1: Generating and Using ROSA Descriptors
Objective: To create computationally efficient and physically meaningful descriptors from a crystal structure for property prediction [64].
Principle: Robust One-Shot Ab initio (ROSA) descriptors are generated by performing only a single step of a self-consistent field (SCF) calculation in density functional theory (DFT). This non-self-consistent calculation captures electronic structure information (e.g., eigenvalues, total energy components) at a very low computational cost, providing a meaningful physical basis for machine learning [64].
Methodology:
- Input Preparation: Provide the crystal structure file (e.g., .cif format) of the material.
- Single-point Calculation: Run a single SCF step using a linear combination of atomic orbitals (LCAO) basis set at a low level of theory (e.g., using DFT with the PBE functional). Do not run to full convergence.
- Descriptor Extraction: From the output of this calculation, extract the following to form the ROSA descriptor vector [64]:
- Eigenvalues from the resulting Kohn-Sham equations.
- Components of the total energy (e.g., kinetic, Hartree, exchange-correlation).
- This typically results in a vector of ~109 descriptors.
- Model Training: Use the extracted ROSA descriptors as input features to train a machine learning model (e.g., Random Forest, Gradient Boosting) to predict your target material property.
Protocol 2: Incorporating Domain Knowledge as Model Constraints
Objective: To guide a deep neural network (DNN) toward behaviorally realistic and interpretable outcomes, thereby improving generalizability on small datasets [65].
Principle: Domain knowledge, often expressed as theoretical rules or constraints (e.g., "utility must decrease with price" in economics, "energy must be positive" in physics), is incorporated into the model's training process as an additional penalty term in the loss function [65].
Methodology:
- Define Constraints: Formulate your domain knowledge into a set of mathematical inequalities or equalities. For example, for a property that should be monotonic with a feature
x:∂Prediction/∂x ≥ 0. - Model Selection: Choose a flexible model architecture, such as a standard Deep Neural Network (DNN).
- Modify Loss Function: During training, use a custom loss function
L_totalthat is a weighted sum of the standard prediction error (e.g., Mean Squared Error) and a penalty term for violating the domain constraints [65].L_total = L_prediction + λ * L_constraints- Here,
λis a hyperparameter controlling the strength of the constraint.
- Train and Validate: Train the model with the modified loss function. Validate that the final model's predictions adhere to the defined domain constraints and check for improvement in generalization error on a hold-out test set.
Workflow and Process Diagrams
Diagram 1: Small Data ML Workflow
This diagram outlines the core workflow for building an interpretable machine learning model in materials science, highlighting key steps to mitigate overfitting.
Diagram 2: Data Learning Paradigm
This diagram illustrates the Data Learning Paradigm, which integrates data assimilation with machine learning to improve predictions for physical systems, a key strategy for working with real-world data challenges [67].
Research Reagent Solutions
The following table details key computational "reagents" and methodologies used in the featured experiments for generating meaningful descriptors and combating overfitting.
| Item/Technique | Function/Benefit | Key Application Context |
|---|---|---|
| ROSA Descriptors [64] | Provides a set of ~109 computationally cheap, physically-grounded descriptors from a single SCF step, satisfying the MENA criteria. | Predicting a wide range of material properties (electronic, mechanical, vibrational) for crystals and molecules with small data. |
| Domain Knowledge Constraints [65] | Penalizes model deviations from known physical rules during training, ensuring behaviorally realistic and interpretable outputs. | Guiding flexible models (e.g., DNNs) in travel demand analysis and materials science to avoid implausible predictions. |
| Transfer Learning [3] [6] | Leverages knowledge from large source datasets to improve performance and training efficiency on small target datasets. | Applying models pre-trained on massive materials databases (e.g., Materials Project) to a novel, limited dataset. |
| Active Learning [3] | An iterative algorithm that selects the most informative data points to label next, optimizing experimental resources. | Prioritizing which new compositions or structures to synthesize or simulate when the experimental budget is limited. |
| Inherently Interpretable Models [66] | Models like linear regression or decision trees whose prediction logic is transparent and easily understood by humans. | The baseline choice for small datasets where model transparency is as important as predictive accuracy. |
Frequently Asked Questions (FAQs)
FAQ 1: How can I prevent my initial model from overfitting on a small labeled dataset before starting the active learning cycle? It is common for the initial model to overfit on a small starting dataset. You should not worry excessively about this, as the active learning process is designed to progressively correct the initial model by feeding it new, informative data. The key is to ensure the initial model is decent enough that the active learning loop does not require an excessive number of labeling iterations to become effective. Using a separate validation set to monitor performance is also recommended [68].
FAQ 2: What is the fundamental difference between Active Learning and Transfer Learning for handling small datasets? The core difference lies in their operational mechanism. Active Learning is an iterative feedback process that selectively queries the most valuable data points from an unlabeled pool to be labeled, thereby improving the model efficiently [69] [70]. Transfer Learning, conversely, reuses knowledge (e.g., model weights or features) learned from a large, data-rich "source" domain to build accurate models on a small, "target" domain, even if the properties being predicted are different [71] [72].
FAQ 3: When should I prioritize exploration over exploitation in my active learning strategy? The choice depends on your primary goal. Use exploitation (e.g., selecting data points with the highest predicted property value) when your objective is to quickly find the best-performing materials or compounds. Use exploration (e.g., selecting data points where the model is most uncertain) when you want to improve the model's overall understanding of the search space, which is particularly useful in early stages or when the data landscape is poorly understood [73].
FAQ 4: Can Transfer Learning be used when my target property has no large public dataset available? Yes. This is addressed by cross-property transfer learning. A model is first pre-trained on a large dataset of a different but available property (e.g., formation energy from the OQMD database). The knowledge from this model is then transferred to your small target dataset of a different property (e.g., dielectric constant) by using the pre-trained model as a feature extractor or by fine-tuning it on your new data [71].
FAQ 5: What are the key challenges in applying these frameworks to drug discovery? Key challenges include the rarity of synergistic drug pairs, the enormous combinatorial search space of possible drug combinations, and the high cost of experiments. Active learning must be strategically designed to navigate this space efficiently. Furthermore, incorporating the right features, such as cellular environment context (e.g., gene expression profiles), is critical for making accurate predictions on bioactivity [70].
Troubleshooting Guide
| Problem | Possible Cause | Solution |
|---|---|---|
| Model performance plateaus in active learning | The query strategy is stuck in a local optimum or is no longer selecting informative data points. | Dynamically tune the exploration-exploitation trade-off. Introduce more exploration to probe uncertain regions of the data space [70]. |
| Transfer learning model performs poorly on the target task | Significant divergence between the source and target domains/tasks, causing "negative transfer". | Use a fine-tuning approach instead of just feature extraction. Gradually unfreeze and retrain the later layers of the pre-trained model on your target data to better adapt the learned features [71] [72]. |
| High computational cost during iterative training | Retraining the model from scratch after every new data acquisition in active learning. | Implement batch selection instead of single-point queries. This allows you to select multiple informative samples in one round, reducing the total number of retraining cycles [73] [70]. |
| Low yield of high-performing candidates (e.g., synergistic drugs) | The selection strategy is not efficiently navigating the combinatorial space, or the batch size is too large. | Reduce the batch size for each active learning iteration. Smaller batch sizes have been shown to yield a higher proportion of synergistic discoveries [70]. |
| Model is biased towards the source domain data | The pre-trained model's feature representations are overly specialized to the source property. | Employ a horizontal transfer strategy (transfer across different material systems) or a vertical transfer strategy (transfer across different data fidelities) to build more robust, domain-agnostic features [72]. |
Table 1: Performance of Cross-Property Transfer Learning
This table summarizes the effectiveness of a cross-property deep transfer learning framework, as demonstrated on computational and experimental materials datasets. The TL models used only elemental fractions as input and were compared against models trained from scratch (SC) that were allowed to use domain-knowledge-driven physical attributes (PA) [71].
| Model Type | Input Features | Number of Computational Datasets Where TL Outperformed SC/PA | Performance on Experimental Datasets |
|---|---|---|---|
| Transfer Learning (TL) | Elemental Fractions only | 27 out of 39 (≈69%) | Outperformed SC/PA models on both datasets tested |
| Trained from Scratch (SC) | Elemental Fractions | 12 out of 39 (≈31%) | Not Applicable |
| Trained from Scratch with Physical Attributes (SC/PA) | Physical Attributes | (Used as a baseline for comparison) | Underperformed compared to TL |
Table 2: Impact of Active Learning Batch Size on Discovery Efficiency
This table illustrates the effect of batch size on the efficiency of discovering synergistic drug combinations using an active learning framework on the Oneil dataset. The goal was to discover synergistic drug pairs, which are rare (3.55% of the dataset) [70].
| Active Learning Scenario | Total Measurements | Synergistic Pairs Discovered | Experimental Efficiency |
|---|---|---|---|
| Exhaustive Search (No Strategy) | 8,253 | 300 | Baseline |
| Active Learning (Optimal) | 1,488 | 300 | Saved ~82% of experiments |
| Smaller Batch Sizes | Not Specified | Higher yield ratio of synergies | More efficient discovery |
Experimental Protocols
Protocol 1: Implementing a Cross-Property Transfer Learning Framework
This methodology allows you to build a robust model for a small target dataset by leveraging knowledge from a large source dataset of a different property [71].
Source Model Training:
- Data Collection: Obtain a large source dataset (e.g., the OQMD database with 300k+ data points for formation energy).
- Model Architecture: Use a deep learning model like ElemNet, which takes only raw elemental fractions as input.
- Training: Train this model from scratch on the source dataset until validation loss converges.
Knowledge Transfer to Target Property:
- Data Collection: Prepare your small target dataset (e.g., a few hundred samples for a property like exfoliation energy).
- Transfer Method (Choose one):
- Fine-tuning: Use the pre-trained source model as a starting point. Replace the final output layer to match your target property. Re-train (fine-tune) the entire model on your small target dataset using a low learning rate.
- Feature Extraction: Use the pre-trained source model as a fixed feature extractor. Remove its final output layer and use the activations from the preceding layer as input features for a new, simpler model (e.g., a Ridge Regression or a shallow neural network) which you then train on the target dataset.
Protocol 2: Setting Up an Active Learning Cycle for Drug Synergy Screening
This protocol outlines the iterative process of using an AI model to guide experiments in finding synergistic drug combinations [70].
Initialization:
- Pool of Candidates: Define the vast combinatorial space of all possible drug pairs and cell lines of interest.
- Initial Model: Pre-train a prediction model (e.g., a Multi-Layer Perceptron) on any existing public synergy data (e.g., Oneil dataset). Use Morgan fingerprints for drug features and gene expression profiles (e.g., from GDSC database) for cellular context features.
- Labeled Seed Set: Start with a very small, randomly selected set of drug combinations whose synergy has been experimentally measured.
Iterative Active Learning Loop:
- Step 1 - Model Training: Train the model on the current labeled seed set.
- Step 2 - Prediction & Selection: Use the trained model to predict synergy scores for all unlabeled candidates in the pool. Apply a selection strategy (e.g., uncertainty sampling for exploration, or expected improvement for exploitation) to choose the most informative
kcandidates (a batch) for the next experiment. - Step 3 - Experimental Labeling: Conduct wet-lab experiments to measure the synergy scores for the selected
kcandidates. - Step 4 - Database Update: Add the newly labeled
kcandidates to the labeled seed set. - Repeat steps 1-4 until the experimental budget is exhausted or a performance target is met.
Workflow Visualization
Diagram 1: Cross-Property Transfer Learning Workflow
Diagram 2: Active Learning Cycle for Drug Discovery
The Scientist's Toolkit: Research Reagent Solutions
| Item Name | Type | Function & Application | Key Details |
|---|---|---|---|
| OQMD (Open Quantum Materials Database) | Materials Database | Large-scale source dataset for pre-training transfer learning models on properties like formation energy [71]. | Contains over 300,000 DFT-computed data entries; often used as a source for cross-property TL. |
| JARVIS (JARVIS-DFT) | Materials Database | Provides a variety of target properties for benchmarking and applying transfer learning models on smaller datasets [71]. | Includes 28,000+ compounds with over 36 different properties. |
| ElemNet | Deep Learning Model | A deep neural network architecture that uses only elemental fractions as input, ideal for transfer learning due to its simple but powerful representations [71]. | 17-layer fully-connected architecture; can be pre-trained and then fine-tuned or used as a feature extractor. |
| Morgan Fingerprints | Molecular Descriptor | A circular fingerprint representation of molecular structure, used as input features for drug-related activity prediction models in active learning [70]. | Encodes the presence of specific substructures; commonly used with AI models for synergy prediction. |
| GDSC Gene Expression | Cellular Feature Dataset | Provides genomic context (gene expression profiles) for cell lines, significantly improving the accuracy of drug synergy prediction models [70]. | Profiles from the Genomics of Drug Sensitivity in Cancer database; as few as 10 key genes can be sufficient. |
From Theory to Practice: Fine-Tuning and Regularizing Your Models for Maximum Robustness
Frequently Asked Questions
Q1: Why is hyperparameter optimization particularly challenging with small datasets? In low-data regimes, commonly encountered in fields like materials science, the limited number of data points makes models highly susceptible to overfitting. A model may appear to perform well during training but fail to generalize to new, unseen data. Traditional tuning methods like grid or random search are less efficient and can inadvertently select hyperparameters that overfit to the noise in the small training set [3] [74].
Q2: What makes Bayesian Optimization (BO) superior to grid and random search for small datasets? Bayesian Optimization is a more efficient, informed search method. Unlike grid or random search, which do not learn from past evaluations, BO builds a probabilistic surrogate model of the objective function (e.g., validation error) and uses it to intelligently select the next hyperparameters to evaluate. This allows it to find good hyperparameters in fewer iterations, which is crucial when each model training is computationally expensive [75] [76].
Q3: How can I explicitly penalize overfitting during the hyperparameter optimization process? You can design an objective function for Bayesian Optimization that directly accounts for overfitting. One effective method is to use a combined metric from different cross-validation (CV) strategies. For instance, you can average the Root Mean Squared Error (RMSE) from a standard k-fold CV (testing interpolation) and a sorted k-fold CV (testing extrapolation). This combined score encourages the selection of models that generalize well both within and beyond the range of the training data [74].
Q4: What is nested cross-validation, and why is it critical when tuning hyperparameters on small data? Nested cross-validation (CV) is a best-practice technique to obtain an unbiased estimate of your model's performance when combined with hyperparameter tuning. It involves two layers of cross-validation: an inner loop for hyperparameter optimization and an outer loop for performance evaluation. This prevents information leakage from the test set into the tuning process, giving you a realistic measure of how your model will perform on new data [77].
Q5: Which specific Bayesian Optimization algorithm is well-suited for small-data problems? The Tree-structured Parzen Estimator (TPE) is a popular choice for Bayesian Optimization in low-data regimes. It models the probability of the hyperparameters given the performance of the objective function, making it efficient for complex and high-dimensional search spaces where traditional methods struggle [76].
Troubleshooting Guides
Problem: Model performance is excellent on training data but poor on validation/hold-out data.
Potential Cause & Solution: This is a classic sign of overfitting.
- Refine your BO Objective: Do not use a simple training error. Implement a robust objective function for BO that incorporates cross-validation and penalizes overfitting, such as the combined interpolation/extrapolation RMSE metric [74].
- Increase Regularization: Hyperparameters that control model complexity (e.g., L1/L2 regularization, tree depth, dropout rate) are your primary levers. Use BO to find the optimal level of regularization that prevents the model from memorizing the noise in your small dataset [74].
- Enforce Nested CV: Always use a nested cross-validation structure to ensure your performance estimates are reliable and not optimistically biased [77].
Problem: The Bayesian Optimization process is not converging to a good solution.
Potential Cause & Solution:
- Check the Search Space: Your defined hyperparameter distributions (the domain) might not include the optimal values. Review literature or prior knowledge to define a sensible and bounded search space. Using log-uniform distributions for hyperparameters like learning rates that span orders of magnitude is often beneficial [76] [78].
- Inspect the Surrogate Model: The surrogate model (e.g., Gaussian Process, TPE) might be a poor fit for your objective function's landscape. Consider trying a different surrogate model. The TPE algorithm is often a robust default choice [76].
Problem: The optimized model does not extrapolate well to new regions of the materials space.
Potential Cause & Solution:
- Incorporate Extrapolation Metrics: Standard validation often only tests interpolation. Explicitly add an extrapolation term to your BO objective function. For example, use a "sorted k-fold CV" where the data is split based on the target value, forcing the model to predict on the highest or lowest ranges not seen in the training fold for that split [74].
Quantitative Comparison of Hyperparameter Tuning Methods
The following table summarizes the core characteristics of different hyperparameter optimization methods, highlighting why Bayesian methods are preferred in data-constrained environments.
| Method | Key Principle | Efficiency in Low-Data Regimes | Risk of Overfitting | Best-Suited Scenario |
|---|---|---|---|---|
| Manual Search | User intuition and trial-and-error [78] | Very Low | High | Initial explorations and when domain expertise is very strong. |
| Grid Search | Exhaustively evaluates all combinations in a predefined grid [75] | Low | Moderate | Small, well-understood hyperparameter spaces. |
| Random Search | Evaluates random combinations from defined distributions [78] | Medium | Moderate | Larger hyperparameter spaces where some dimensions are less important. |
| Bayesian Optimization (e.g., TPE) | Builds a surrogate model to guide the search to promising regions [76] [74] | High | Low (when properly configured) | Limited data budgets and expensive-to-evaluate models. |
Experimental Protocol: Implementing Anti-Overfitting Bayesian Optimization
This protocol details the steps to implement a Bayesian Optimization workflow designed to mitigate overfitting, as demonstrated in chemical informatics studies [74].
Data Preparation:
- Split the dataset into an internal set (80%) and a completely held-out external test set (20%). Use an "even" split method to ensure the test set is representative of the target value range.
- The external test set is only used for the final evaluation and must not be used during hyperparameter tuning.
Define the Hyperparameter Search Space (Domain):
- Define probability distributions for each hyperparameter. For example:
learning_rate: Log-uniform distribution between 0.001 and 0.1.n_estimators: Integer uniform distribution between 50 and 500.max_depth: Integer uniform distribution between 3 and 15.
- Define probability distributions for each hyperparameter. For example:
Configure the Bayesian Optimization Objective Function:
- The core of the anti-overfitting strategy is a custom objective function that combines interpolation and extrapolation performance.
- For a given set of hyperparameters, the objective function performs:
- Interpolation CV: A 10-times repeated 5-fold cross-validation on the internal set.
- Extrapolation CV: A sorted 5-fold cross-validation, where the data is ordered by the target variable and split, testing the model's ability to predict the highest and lowest values.
- Calculate the RMSE for both the interpolation and extrapolation CV procedures.
- The final score for the hyperparameter set is the combined RMSE, typically the average of the interpolation and extrapolation RMSEs.
Execute the Optimization Loop:
- Using a BO algorithm like TPE, iterate through the following until a stopping condition is met (e.g., 100 iterations):
- The surrogate model suggests the next set of hyperparameters to evaluate based on the Expected Improvement (EI) criterion.
- The objective function (Step 3) is evaluated for these hyperparameters.
- The result (hyperparameters and combined RMSE) is used to update the surrogate model.
- Using a BO algorithm like TPE, iterate through the following until a stopping condition is met (e.g., 100 iterations):
Final Evaluation:
- Train a final model on the entire internal set using the hyperparameters that achieved the best combined RMSE score during BO.
- Evaluate this final model's performance on the completely held-out external test set to obtain an unbiased estimate of its generalization error.
Workflow Diagram: Anti-Overfitting Bayesian Optimization
The following diagram illustrates the logical flow and feedback loops of the Bayesian Optimization process with an anti-overfitting objective.
The Scientist's Toolkit: Research Reagent Solutions
The table below lists key computational "reagents" and their functions for implementing the described methodology.
| Tool / Technique | Function in the Experiment | Key Consideration for Low-Data Regimes |
|---|---|---|
| Tree-structured Parzen Estimator (TPE) | Bayesian Optimization algorithm that acts as the surrogate model to efficiently navigate the hyperparameter space [76]. | More sample-efficient than random/grid search, making it ideal when the number of objective function evaluations is limited. |
| Combined CV Metric | The custom objective function that balances interpolation and extrapolation performance to penalize overfitting [74]. | Directly addresses the core weakness of small-data modeling by explicitly optimizing for generalization. |
| Nested Cross-Validation | A validation framework that provides an unbiased estimate of model performance when hyperparameter tuning is involved [77]. | Prevents optimistic performance estimates, which is critical for making reliable conclusions with limited data. |
| SHAP (SHapley Additive exPlanations) | A post-hoc interpretation tool to explain the output of the optimized machine learning model [79]. | Increases trust in complex non-linear models by providing insights into which features drive predictions. |
| Regularization Hyperparameters | Model settings (e.g., L1, L2, dropout rates) that control complexity and prevent the model from fitting noise [74]. | These are the most critical hyperparameters to tune in low-data regimes to enforce simplicity and improve generalization. |
Troubleshooting Guides and FAQs
This technical support resource addresses common challenges researchers face when implementing key regularization techniques to mitigate overfitting in machine learning models, with a particular focus on the small-data context common in materials science research [3].
L1 and L2 Regularization
Problem: A materials researcher is building a model to predict the hardness of new alloys using 50 compositional and processing features. The model performs well on training data but fails to predict the properties of new compositions accurately.
Diagnosis: This is a classic case of overfitting, where the model has learned noise and specific patterns from the limited training data that do not generalize [19]. Given the high number of features relative to typical dataset sizes in materials science, L1 or L2 regularization is recommended [80] [3].
Solution: Apply L1 or L2 regularization to constrain the model's complexity.
Action 1: Implement L1 (Lasso) Regularization for Feature Selection L1 regularization adds a penalty equal to the absolute value of the magnitude of coefficients to the loss function [80] [81]. This can be particularly useful when you suspect that only a subset of your features (e.g., key elemental descriptors) is truly important, as it can drive the weights of irrelevant features to zero [80] [82].
Action 2: Implement L2 (Ridge) Regularization for Small Weight Decay L2 regularization adds a penalty equal to the square of the magnitude of coefficients [80] [81]. It shrinks all weights but does not set any to zero, making it suitable when you believe all features might have some influence on the target property [81] [83].
Action 3: Hyperparameter Tuning for λ (Lambda) The regularization strength
λis a critical hyperparameter [81]. A value that is too low will not prevent overfitting, while a value that is too high can lead to underfitting [80].
FAQ: Should I use L1 or L2 regularization for my materials dataset? The choice depends on your goal. Use L1 (Lasso) if you want a sparse model and need to identify the most critical features (e.g., which elemental properties most influence a material's performance) [80] [81]. Use L2 (Ridge) if you want to handle multicollinearity and keep all features in the model while reducing their impact [80] [81]. In the presence of highly correlated features, L2 is generally more stable [81].
Dropout
Problem: A deep neural network trained on spectral data for polymer classification achieves 99% training accuracy but only 65% accuracy on the validation set.
Diagnosis: The network is overfitting by "memorizing" the training examples instead of learning generalizable features. This is a common risk with complex models trained on small datasets [3].
Solution: Apply dropout regularization to prevent complex co-adaptations of neurons to the training data.
Action 1: Introduce Dropout Layers Add a dropout layer after dense or convolutional layers in your network. During training, dropout randomly "drops" a fraction of neurons (sets their output to zero) in each forward pass [80] [83].
- Typical Dropout Rate: A common starting rate is 0.5 (50% of neurons dropped) for hidden layers and 0.2-0.5 for input layers [82].
Action 2: Compensate for Training Time Dropout forces the network to learn redundant representations, which often requires more training epochs to converge [80]. Monitor the validation loss closely to determine the new optimal stopping point.
Action 3: Ensure Dropout is Disabled at Inference Remember that dropout is only active during training. At test time, all neurons should be used, and their outputs are typically scaled by the dropout probability to ensure the expected output magnitude is consistent [81] [83].
FAQ: Why is my model's training error higher after using dropout? This is expected and desired. Dropout reduces the network's capacity to overfit the training data, so the training error will be higher. The key metric to monitor is the validation error; if it decreases, the model is generalizing better [83]. If both training and validation error are high, the dropout rate might be too high, causing underfitting.
Early Stopping
Problem: Training a model to predict the bandgap of perovskites shows that validation loss stops decreasing and begins to increase after a certain number of epochs, even as training loss continues to fall.
Diagnosis: The model is beginning to overfit by learning the noise in the training data after it has captured the underlying patterns.
Solution: Implement early stopping to halt training at the point of best validation performance.
Action 1: Set Up a Validation Set Split your training data into training and validation sets (e.g., an 80-20 split) [84]. The model will be trained on the former and monitored on the latter.
Action 2: Configure Patience Parameter Define a
patiencevalue: the number of epochs to wait after the validation metric has stopped improving before stopping the training [80]. A commonpatiencevalue is 5-20 epochs, depending on dataset size and training stability.- Protocol: Monitor the validation loss (or another metric like validation accuracy). After each epoch, check if it has improved. If no improvement is seen for
patienceconsecutive epochs, training is automatically stopped, and the model weights from the epoch with the best validation score are restored [80] [82].
- Protocol: Monitor the validation loss (or another metric like validation accuracy). After each epoch, check if it has improved. If no improvement is seen for
Action 3: Use Callbacks Most modern deep learning frameworks (like TensorFlow/Keras and PyTorch) provide early stopping callback functions. Implement these to automate the process.
FAQ: Could early stopping cause my model to underfit?
Yes, if the patience parameter is set too low, training might be halted before the model has had sufficient time to learn the key patterns from the training data, leading to underfitting [80]. To mitigate this, you can set a higher patience value or ensure your training dataset is large and diverse enough through data augmentation [80].
Technician's Toolkit: Regularization Techniques at a Glance
The following table summarizes the key regularization techniques, their mechanisms, and their applicability to challenges in materials science.
Table 1: Comparison of Regularization Techniques for Materials Science Research
| Technique | Core Mechanism | Best For Materials Science Use Cases | Key Hyperparameters | Advantages | Limitations |
|---|---|---|---|---|---|
| L1 (Lasso) [80] [81] | Adds absolute value of weights to loss; promotes sparsity. | High-dimensional data (e.g., many elemental descriptors); feature selection to identify critical factors. | Regularization strength (λ). | Creates simpler, interpretable models; performs feature selection. | Can be unstable with correlated features; may remove useful features. |
| L2 (Ridge) [80] [81] | Adds squared value of weights to loss; shrinks weights uniformly. | Problems where all features may be relevant (e.g., composition & processing parameters); correlated features. | Regularization strength (λ). | Stable with correlated features; preserves all features. | Does not perform feature selection. |
| Dropout [80] [83] | Randomly disables neurons during training. | Large neural networks (e.g., for image analysis of microstructures); preventing neuron co-adaptation. | Dropout rate (p). | Highly effective for neural networks; acts like ensemble learning. | Increases number of training epochs needed; less effective for very small networks [80]. |
| Early Stopping [80] [19] | Halts training when validation performance stops improving. | All models, especially when training is computationally expensive (e.g., large-scale DFT data). | Patience (epochs to wait). | Simple to implement; no changes to model; saves compute time. | Risk of stopping too early (underfitting) if patience is too low [80]. |
Experimental Protocol and Workflow
Standard Operating Procedure: Implementing Regularization for a Materials Property Prediction Model
1. Objective: Train a model to predict a target material property (e.g., ionic conductivity) from a set of features while avoiding overfitting on a small dataset.
2. Prerequisites:
- Dataset of material samples with features (descriptors) and target property.
- Preprocessed data (cleaned, normalized).
- Training, validation, and test sets.
3. Procedure:
- Step 1: Baseline Model. Train a model without any regularization and establish a baseline performance on the training and validation sets.
- Step 2: Technique Selection. Based on your model and data, select a regularization technique:
- For linear models or when feature importance is needed, start with L1.
- For neural networks, implement Dropout and L2 Weight Decay.
- For all models, implement Early Stopping.
- Step 3: Hyperparameter Tuning. Use cross-validation on the training set to find optimal hyperparameters (e.g.,
λfor L1/L2,pfor dropout,patiencefor early stopping). - Step 4: Final Training. Train the model on the entire training set (using the validation set for early stopping) with the optimized hyperparameters.
- Step 5: Evaluation. Report the final model's performance on the held-out test set.
Workflow Visualization
The following diagram illustrates the decision-making workflow for selecting and applying these regularization techniques in a materials science research project.
Decision Workflow for Regularization
Essential Research Reagent Solutions
This table lists key "reagents" – the algorithms and strategies – essential for a successful experiment in regularized machine learning for materials science.
Table 2: Essential "Research Reagents" for Regularization
| Reagent (Algorithm/Strategy) | Function/Purpose | Typical Application in Materials Science |
|---|---|---|
| L1 (Lasso) Regularization [80] [81] | Penalizes absolute weights; induces sparsity and feature selection. | Identifying the most critical elemental descriptors or processing parameters from a large pool. |
| L2 (Ridge) Regularization [80] [81] | Penalizes squared weights; shrinks coefficients uniformly. | Stabilizing property prediction models (e.g., predicting hardness) where all features may contribute. |
| Dropout [80] [83] | Randomly ignores neurons during training; prevents co-adaptation. | Regularizing deep learning models applied to complex data like microscopy images or spectral graphs. |
| Early Stopping Callback [80] [19] | Monitors validation loss and stops training to prevent overfitting. | A universal tool for any iterative training process, conserving computational resources. |
| K-Fold Cross-Validation [19] [84] | Robustly estimates model performance and tunes hyperparameters. | Critical for small materials datasets to maximize the use of available data and ensure reliable model selection [3]. |
Troubleshooting Guides & FAQs
Why should I reduce dimensionality in my materials science dataset?
High-dimensional datasets, often with many features (e.g., elemental, structural, and process descriptors), pose a significant risk of overfitting, especially when sample sizes are small. This is often referred to as the "curse of dimensionality" [85]. Dimensionality reduction mitigates this by:
- Preventing Overfitting: With fewer, more relevant features, models are less likely to memorize noise and more likely to generalize to new, unseen data [86].
- Improving Computational Efficiency: Algorithms process data faster with fewer features, speeding up model training and testing [86].
- Enhancing Visualization and Interpretability: Reducing features to 2 or 3 dimensions allows for visual inspection of data patterns and hidden structures [87].
My dataset is very small. Which techniques are most suitable?
With small datasets, the risk of overfitting is high. Your strategy should focus on techniques that maximize data utility and model simplicity.
- Prioritize Feature Selection: Methods that select a subset of the most important original features (rather than transforming them) can be more interpretable, which is valuable for scientific discovery.
- Use Regularization: Employ models with built-in feature selection (embedded methods), such as Lasso Regression (L1 regularization), which penalizes less important features by shrinking their coefficients to zero [13] [88].
- Leverage Domain Knowledge: Before applying any algorithm, use your expertise to filter out irrelevant features. This can bias the model away from spurious correlations and towards meaningful relationships, reducing complexity with little impact on performance [89].
What is the practical difference between Feature Selection and Feature Extraction?
The key difference lies in whether you keep the original features or create new ones.
- Feature Selection chooses a subset of the most relevant features from the original set without altering them [86] [87]. The features remain interpretable (e.g., you might select "melting temperature" and "atomic radius" while discarding others).
- Feature Extraction creates new, fewer features by combining or transforming the original ones [86] [87]. The new features (e.g., "Principal Component 1") are often a complex combination of the originals and can be harder to interpret, but they often capture the maximum variance in the data.
The following workflow diagram illustrates how these techniques integrate into a machine learning pipeline for materials science.
How do I choose between PCA and LDA for my project?
The choice depends on whether your learning problem is unsupervised (PCA) or supervised (LDA).
| Aspect | Principal Component Analysis (PCA) | Linear Discriminant Analysis (LDA) |
|---|---|---|
| Primary Goal | Maximize variance in the data [85] | Maximize separation between known classes [85] |
| Learning Type | Unsupervised (does not use label information) [85] | Supervised (uses label information) [85] |
| Output | Principal Components (directions of max variance) | Linear Discriminants (axes for best class separation) |
| Best Suited For | Exploratory data analysis, compression, visualizing general data structure [87] | Classification tasks, improving predictive performance for a specific target [87] |
I've heard about t-SNE. When should I use it?
t-Distributed Stochastic Neighbor Embedding (t-SNE) is a powerful non-linear technique primarily for data visualization [87] [85]. Its key characteristics are:
- Purpose: Excellent for visualizing high-dimensional data in 2D or 3D plots by preserving the local structure of the data, which often reveals intuitive clusters [87].
- Limitation: The output is typically limited to 2 or 3 dimensions and can be computationally expensive for very large datasets. The plots are primarily for exploration and not for feeding into another predictive model [85].
- Use Case: You would use t-SNE to visually check if your materials data (e.g., different alloy compositions) naturally forms clusters before building a formal classification model.
Experimental Protocols & Methodologies
Protocol: Feature Selection using a Filter Method
This protocol uses statistical measures to select features independently of a machine learning model.
- Data Preprocessing: Clean and normalize your data. Handle missing values through deletion or imputation [3].
- Choose a Statistical Measure: Select a measure to evaluate the relationship between each feature and the target variable. Common measures include:
- Pearson's Correlation: For linear relationships with a continuous target.
- Mutual Information: Can capture any kind of relationship, both linear and non-linear [89].
- Chi-Squared Test: For categorical features and a categorical target.
- Calculate Scores: Compute the chosen statistical measure for every feature in your dataset.
- Rank and Select: Rank the features based on their scores in descending order. Select the top k features, where k can be determined by domain knowledge or by evaluating model performance across different values of k.
Protocol: Dimensionality Reduction using Principal Component Analysis (PCA)
PCA is a feature extraction method that transforms your data into a set of linearly uncorrelated principal components [86] [87].
- Standardization: Standardize the dataset to have a mean of zero and a standard deviation of one for each feature. This is critical because PCA is sensitive to the variances of the original variables [87].
- Covariance Matrix Computation: Compute the covariance matrix of the standardized data to understand how the features deviate from the mean relative to each other.
- Eigendecomposition: Calculate the eigenvectors (principal components) and eigenvalues (amount of variance explained) of the covariance matrix.
- Sort Components: Sort the eigenvectors by their eigenvalues in descending order. The eigenvector with the highest eigenvalue is the principal component that captures the most variance.
- Project Data: Select the top k eigenvectors and project your original data onto this new subspace to create a new, lower-dimensional dataset. This is done by multiplying the original data matrix by the matrix of selected eigenvectors.
The following diagram illustrates this multi-step process for PCA.
The Scientist's Toolkit: Research Reagent Solutions
This table details key computational "reagents" for feature engineering and selection.
| Tool / Technique | Category | Primary Function |
|---|---|---|
| L1 Regularization (Lasso) | Embedded Method | Performs feature selection during model training by shrinking less important feature coefficients to exactly zero [13] [88]. |
| Mutual Information Score | Filter Method | A statistical measure used to rank features based on their dependency with the target variable, capable of capturing non-linear relationships [89]. |
| Recursive Feature Elimination (RFE) | Wrapper Method | Iteratively constructs a model (e.g., SVM) and removes the weakest feature(s) until a specified number of features remains [88]. |
| Principal Component Analysis (PCA) | Feature Extraction | Transforms high-dimensional data into a lower-dimensional space of principal components that capture the maximum variance [86] [87]. |
| t-SNE | Manifold Learning | A non-linear technique for visualizing high-dimensional data in 2D or 3D by preserving local data structures and revealing clusters [87]. |
| Random Forest | Embedded Method | Provides intrinsic feature importance scores based on how much each feature decreases impurity (e.g., Gini) across all decision trees in the forest [86] [88]. |
FAQs and Troubleshooting Guide
This technical support center provides practical guidance for researchers addressing the common challenge of class imbalance in small materials science and drug development datasets.
Understanding and Assessing Imbalance
What defines a class-imbalanced dataset? An imbalanced dataset occurs when one class (the majority class) has a significantly higher number of instances than another class (the minority class). This is common in real-world scenarios like detecting rare diseases or synthesizing novel materials, where the event of interest is infrequent [90].
Why is class imbalance a critical problem in scientific research? Standard classifiers aim to maximize overall accuracy and often become biased toward the majority class. Consequently, the model may fail to learn the patterns of the minority class, which is often the class of greater scientific interest, such as a promising drug candidate or a material with a specific property. This leads to poor predictive performance for the minority class [91] [90].
How can I properly evaluate a model trained on imbalanced data? Avoid relying solely on accuracy, as it can be misleading (the "accuracy paradox") [92]. Instead, use a combination of metrics:
- Threshold-independent metrics: ROC-AUC (Area Under the Receiver Operating Characteristic Curve) and PRAUC (Area Under the Precision-Recall Curve) are recommended as they evaluate model performance across all classification thresholds [93] [94].
- Threshold-dependent metrics: Precision, Recall, F1-Score, and Balanced Accuracy (BACC) are crucial. When using these, it is essential to optimize the decision threshold instead of using the default 0.5 value [94]. A tuned threshold can often achieve the same performance benefits as applying complex resampling techniques [94].
Data-Level Solutions: Resampling
Should I use oversampling or undersampling for my dataset? The choice depends on your dataset size and the classifier you are using. The following table summarizes the core characteristics, advantages, and drawbacks of each approach.
Table 1: Comparison of Oversampling and Undersampling Techniques
| Feature | Oversampling | Undersampling |
|---|---|---|
| Core Principle | Increases the number of minority class instances [92] | Decreases the number of majority class instances [92] |
| Key Advantage | Preserves all original data and information from the majority class [95] | Reduces computational cost and storage requirements; leads to faster training [92] |
| Main Disadvantage | Risk of overfitting, especially if synthetic samples are noisy or not representative [93] [95] | Potential loss of useful and information-rich data from the majority class [92] [95] |
| Ideal Use Case | Smaller datasets where data is precious [92] | Very large datasets where the majority class is abundant [92] |
When does SMOTE actually help, and which variant should I choose? SMOTE (Synthetic Minority Over-sampling Technique) generates synthetic samples by interpolating between neighboring minority class instances in feature space [91]. Recent large-scale benchmarking studies offer the following insights [91] [94]:
- Use with "weak" learners: SMOTE and its variants can improve performance for classifiers like Decision Trees, Support Vector Machines, and multilayer perceptrons [94].
- Less effective with "strong" learners: For powerful algorithms like XGBoost and CatBoost, the performance gains from SMOTE are often minimal, especially if the probability threshold is properly tuned [94].
- Start simple: For most cases, random oversampling can provide performance similar to more complex SMOTE variants [94].
Table 2: Common SMOTE Variants and Their Methodologies
| Method | Core Methodology | Best Suited For |
|---|---|---|
| SMOTE | Generates synthetic samples via linear interpolation between a minority instance and its k-nearest neighbors [91]. | General, low-level imbalance. |
| Borderline-SMOTE | Focuses oversampling on minority instances near the decision boundary, which are considered harder to learn [91]. | Datasets where the class boundary is ambiguous. |
| Safe-Level SMOTE | Uses a safety score based on local minority density to reduce the risk of generating noisy samples near majority regions [91]. | Datasets with potential noise and overlapping classes. |
| Cluster-SMOTE | Applies SMOTE within clusters formed by an algorithm like K-means to better preserve the internal structure of the minority class [91]. | Datasets where the minority class has multiple sub-populations. |
| MCSMOTE | A novel method that replaces linear interpolation with a probabilistic sampling framework using a Markov chain transition matrix, generating more diverse samples [93]. | Complex, high-dimensional datasets where linear interpolation is insufficient. |
How can I perform undersampling without losing critical information? Random undersampling, which removes majority class instances at random, carries a high risk of discarding useful information [92]. Advanced methods use heuristic rules to select which instances to remove or keep:
- Tomek Links: Removes majority class instances that are part of a "Tomek Link"—a pair of instances from different classes that are nearest neighbors to each other. This helps clean up overlapping regions and clarifies the decision boundary [92].
- Edited Nearest Neighbors (ENN): Removes any instance (typically from the majority class) that is misclassified by its k-nearest neighbors. This performs a broader cleaning of the dataset, removing noise and redundant points [92].
- Density-Based Methods (e.g., UBMD): Newer methods calculate the density distribution of the minority class and use it to guide the undersampling of the majority class, aiming to preserve information-rich samples that are most relevant to the minority class structure [95].
Algorithm-Level Solutions: Cost-Sensitive Learning
What is cost-sensitive learning and how does it differ from resampling? Cost-sensitive learning is an alternative approach that does not alter the training data. Instead, it modifies the learning algorithm itself to make it more sensitive to the minority class by directly incorporating different costs for different types of misclassification into the model's objective function [96] [97]. For example, the cost of misclassifying a minority class instance (a false negative) can be set to be much higher than the cost of misclassifying a majority class instance (a false positive) [97].
When should I consider a cost-sensitive method? Cost-sensitive learning is highly recommended in the following scenarios:
- To preserve data integrity: When you do not want to alter the original data distribution by adding synthetic points or removing real data points [96].
- As a modern best practice: It is often more straightforward to implement than resampling and has been shown to yield superior performance compared to standard algorithms on imbalanced medical datasets [96].
- When misclassification costs are known: If your domain knowledge allows you to assign specific, meaningful costs to different types of errors, cost-sensitive learning provides a natural framework to incorporate this information [97].
Can I combine resampling and cost-sensitive learning? Yes, these strategies are not mutually exclusive. Hybrid methods exist, such as SMOTEBoost, which integrates SMOTE directly into a boosting algorithm, making the ensemble learning process more focused on correctly classifying the minority class [91].
The Scientist's Toolkit
Table 3: Essential Research Reagents for Imbalance Mitigation
| Tool / Reagent | Function / Purpose | Example Use Case |
|---|---|---|
| Imbalanced-Learn (Python) | An open-source library offering a wide array of resampling techniques, including SMOTE variants, undersampling methods, and hybrid approaches [94]. | Quickly prototyping and comparing different resampling strategies in a Scikit-learn compatible pipeline. |
| XGBoost / CatBoost | So-called "strong" classifiers that are often inherently more robust to class imbalance, especially when combined with a tuned decision threshold [94]. | Establishing a high-performance baseline model before applying any resampling techniques. |
| Cost-Sensitive Classifiers | Modified versions of standard algorithms (e.g., Logistic Regression, Decision Trees, XGBoost) that incorporate a cost matrix during training [96]. | Building models where the original data distribution must be maintained and different error types have known, different consequences. |
| TabPFN | A transformer-based foundation model for small tabular data that performs in-context learning and has shown dominant performance on datasets with up to 10,000 samples [98]. | Rapid benchmarking and obtaining state-of-the-art predictions on small materials science or drug discovery datasets without extensive hyperparameter tuning. |
Experimental Protocols and Workflows
Protocol 1: Systematic Benchmarking of Resampling Methods This protocol is adapted from large-scale benchmarking studies [91] [93].
- Data Preparation: Start with a cleaned dataset. Use stratified sampling to create a hold-out test set that preserves the original class distribution.
- Feature Vectorization: For non-tabular data (e.g., text), convert samples into semantically rich feature vectors. In materials science, this could be using learned embeddings from a foundation model. For standard tabular data, normalize the features.
- Resampling Application: Apply a suite of resampling techniques (e.g., Random Oversampling, SMOTE, Borderline-SMOTE, Tomek Links, ENN) only to the training data after any cross-validation splits are created to avoid data leakage.
- Model Training & Evaluation: Train your selected classifiers (e.g., Decision Tree, Random Forest, XGBoost) on each resampled training set. Evaluate on the untouched, original test set using a comprehensive set of metrics: F1-Score, Balanced Accuracy (BACC), ROC-AUC, and PRAUC [91] [93].
- Statistical Validation: Use statistical tests, such as the Friedman test, to validate whether observed performance differences are significant [91].
Protocol 2: Implementing Cost-Sensitive Learning This protocol is based on research that developed cost-sensitive classifiers for medical diagnosis [96].
- Algorithm Selection: Choose a base algorithm (e.g., Logistic Regression, Decision Tree, XGBoost).
- Cost Matrix Definition: Modify the algorithm's objective function to incorporate a cost matrix. For a binary problem, this typically means setting the
class_weightparameter to "balanced" or manually defining a higher cost for the minority class. The exact implementation varies by library. - Model Training: Train the model on the original, unmodified training data. The cost-sensitive algorithm will automatically adjust the learning process to penalize errors on the minority class more heavily.
- Threshold Tuning: On a validation set, sweep through a range of probability thresholds (e.g., from 0.1 to 0.9) to find the optimal value that maximizes your chosen metric (e.g., F1-Score), rather than using the default 0.5 threshold [94].
Workflow and Method Selection Diagrams
Method Selection Workflow
Core Mitigation Strategies
In materials science and drug development, research is often constrained by small datasets. This data scarcity, stemming from the high cost and labor-intensity of experiments and computations, poses a significant risk of model overfitting [3] [99]. An overfit model fails to generalize, capturing noise instead of underlying patterns and introducing human bias from limited data perspectives.
This guide provides troubleshooting advice for researchers implementing automated workflows designed to overcome these challenges, leveraging strategies like transfer learning, synthetic data generation, and ensemble methods to build more robust and accurate predictive models [100] [99].
Troubleshooting FAQs
Q1: My predictive model performs well on training data but poorly on new validation samples. What is the likely cause and how can I address it?
A: This is a classic sign of overfitting, where your model has memorized the training data instead of learning generalizable patterns [3].
- Primary Cause: The model's complexity is too high relative to the amount and quality of your training data.
- Solutions:
- Simplify Your Model: Reduce model complexity by using algorithms like Lasso regression, which performs feature selection, or tree-based methods like Random Forests that are less prone to overfitting [3].
- Employ an Ensemble of Experts (EE): Use a system of pre-trained models ("experts") on large, high-quality datasets for related properties. These experts generate molecular fingerprints that encapsulate essential chemical information, which can then be used to train a final model on your small dataset. This approach has been shown to significantly outperform standard neural networks in data-scarce scenarios [99].
- Use a Low-Code Automation Tool: Platforms like Estuary Flow or Alteryx offer built-in functionality for feature selection and data validation, helping to automatically identify and reduce redundant descriptors that contribute to overfitting [101].
Q2: What are the most effective machine learning strategies when I have fewer than 100 data points?
A: With extremely small datasets, your strategy must maximize information extraction from every sample.
- Leverage Transfer Learning: This is a powerful technique for small data. Start with a model pre-trained on a large, general materials database (e.g., for a property like formation energy). Then, fine-tune this model using your small, specific dataset. This allows the model to apply broad, learned chemical principles to your specific task [3] [99].
- Generate Synthetic Data: Frameworks like MatWheel use conditional generative models to create synthetic data for material property prediction. In experiments, using this synthetic data for training achieved performance "close to or exceeding that of real samples" in data-scarce tasks [100].
- Incorporate Domain Knowledge: Generate descriptors based on scientific expertise (e.g., physical laws, empirical formulas) to create a more interpretable and constrained model. This guides the learning process and can greatly improve predictive ability where data is limited [3].
Q3: How can I automate my workflow to minimize manual bias in data preprocessing and feature selection?
A: Automation tools can standardize processes, reducing ad-hoc decisions that introduce bias.
- Utilize Automated Feature Engineering: Tools like Alteryx and Coupler.io provide drag-and-drop interfaces for data blending, preprocessing, and transformation. By applying the same rules consistently, you eliminate manual copy-paste errors and formatting inconsistencies [101] [102].
- Implement an Active Learning Loop: This automated strategy uses a model to identify which new data points would be most valuable to acquire. The workflow automatically queries for these points (e.g., through a specific calculation or experiment), which are then added to the training set. This creates a closed-loop system that optimizes data collection and reduces the bias of random sampling [3].
- Adopt an End-to-End Platform: A platform like Estuary Flow can automate the entire data pipeline—from real-time ingestion from databases to transformation and model updating—ensuring a consistent, reproducible flow that minimizes manual intervention [101].
Q4: Which open-source or low-code tools are best for orchestrating these automated workflows without a large engineering team?
A: Several tools are designed for technical users who may not be software engineers.
- For Data Pipeline Orchestration: Apache Airflow is an open-source standard for defining, scheduling, and monitoring workflows as code (Python). It is highly extensible and ideal for complex ETL (Extract, Transform, Load) and data processing pipelines [101] [103].
- For General Workflow Automation: n8n is a highly customizable, open-source tool that supports advanced logic and is developer-friendly, while Activepieces offers a no-code builder that is accessible to non-technical users for creating complex, integrated workflows [104] [103].
- For Enterprise-Grade Processes: Appian is a low-code platform that excels at automating complex, compliance-heavy workflows, making it suitable for regulated research environments [104] [105].
Detailed Methodologies & Protocols
Protocol 1: Implementing an Ensemble of Experts (EE) for Property Prediction
This methodology is adapted from research on predicting properties like glass transition temperature (Tg) and the Flory-Huggins interaction parameter (χ) with limited data [99].
1. Objective: To accurately predict a target material property using a very small dataset (<100 samples) by leveraging knowledge from pre-trained models.
2. Materials & Data Requirements:
- Small Target Dataset: Your limited data, containing material representations (e.g., SMILES strings) and the target property values.
- Large, High-Quality Source Datasets: Several large datasets for related, but different, physical properties (e.g., formation energy, band gap) to train the "expert" models.
3. Step-by-Step Procedure:
- Step 1: Expert Training. Train multiple independent Artificial Neural Networks (ANNs)—the "experts"—each on one of the large source datasets. The goal is for these models to learn general materials knowledge.
- Step 2: Fingerprint Generation. Pass the material representations from your small target dataset through each pre-trained expert. The activations from a hidden layer of each network are extracted and concatenated to form a knowledge-rich fingerprint for each material in your small dataset.
- Step 3: Final Model Training. Use the generated fingerprints as input features to train a final machine learning model (e.g., a simpler ANN or a linear model) to predict your target property.
- Step 4: Validation. Validate the final model's performance on a held-out test set from your small target dataset using metrics like Mean Absolute Error (MAE) or R² score.
The following workflow outlines this ensemble of experts process:
Protocol 2: Generating Synthetic Data with a Conditional Generative Model
This protocol is based on the MatWheel framework for addressing data scarcity in materials science [100].
1. Objective: To augment a small dataset by generating high-quality synthetic samples that improve the performance of a property prediction model.
2. Materials & Data Requirements:
- A small, labeled dataset of materials and their target property.
- A conditional generative model, such as a Conditional Convolutional Dynamic Variational Autoencoder (Con-CDVAE).
3. Step-by-Step Procedure:
- Step 1: Model Training. Train the conditional generative model on your small dataset. The model learns the joint distribution of the material structures and the target property condition.
- Step 2: Data Generation. Condition the trained generator on desired property values to create new, synthetic material structures with corresponding property labels.
- Step 3: Data Integration. Combine the generated synthetic data with the original real data to create an augmented training set.
- Step 4: Predictor Training and Evaluation. Train a property prediction model (e.g., a CGCNN) on the augmented dataset. Evaluate its performance on a held-out test set of only real data to assess improvement.
The workflow for synthetic data generation and application is shown below:
The Scientist's Toolkit: Research Reagent Solutions
Table 1: Key digital and analytical "reagents" for combating overfitting in small-data research.
| Tool/Software Name | Type | Primary Function in Low-Data Scenarios |
|---|---|---|
| Alteryx [101] | Low-Code Analytics Platform | Automates data blending, feature engineering, and validation to reduce manual preprocessing bias. |
| Apache Airflow [101] [103] | Open-Source Workflow Orchestrator | Schedules, monitors, and manages complex data pipelines (e.g., ETL) as code for full reproducibility. |
| MatWheel Framework [100] | Synthetic Data Generator | Creates synthetic materials data to augment small datasets and improve model generalization. |
| Ensemble of Experts (EE) [99] | Machine Learning Strategy | Transfers knowledge from models trained on large datasets to make accurate predictions on small datasets. |
| Activepieces [103] | Open-Source Workflow Automation | Creates automated, integrated workflows between apps and data sources with a no-code interface. |
| n8n [104] [103] | Open-Source Workflow Automation | Enables building of custom, self-hosted automation with advanced logic and API integrations. |
| Estuary Flow [101] | Real-Time Data Automation | Provides continuous data synchronization and transformation across systems, ensuring consistent data flow. |
Ensuring Reliability: Rigorous Validation, Benchmarking, and Model Interpretation
FAQs: Core Concepts and Strategic Choices
Q1: What is the fundamental difference between interpolation and extrapolation in the context of model validation, and why does it matter for materials science?
Interpolation assesses a model's performance on data points that lie within the feature space range of the training set. Extrapolation evaluates its ability to predict for points outside this range. This distinction is critical in materials science, where discovering new materials or synthesizing compounds with superior properties often inherently requires extrapolation. A model might interpolate well but fail catastrophically when predicting a novel polymer's stability outside its training domain, leading to failed experiments and wasted resources. Advanced cross-validation strategies explicitly test for both capabilities.
Q2: My dataset is small (n < 50). Are complex, non-linear models a viable option, or am I stuck with linear regression?
With careful tuning, non-linear models can be viable and even outperform linear models. The key is implementing rigorous workflows designed for low-data regimes. Research shows that automated workflows using Bayesian hyperparameter optimization with an objective function that explicitly penalizes overfitting in both interpolation and extrapolation can enable models like Neural Networks (NN) to perform on par with or better than Multivariate Linear Regression (MVLR) on datasets as small as 18-44 data points [74]. The skepticism towards non-linear models in low-data scenarios stems from their tendency to overfit, which can be mitigated with the right validation strategy.
Q3: When should I use subject-wise versus record-wise cross-validation?
The choice depends on the fundamental unit of your modeling.
- Use Record-wise CV when your model makes predictions for individual, independent measurements or events, even if multiple measurements come from a single source (e.g., a single catalyst). This assumes all records are independent and identically distributed (i.i.d.) [106].
- Use Subject-wise CV when your predictions are intrinsically tied to a higher-level entity (e.g., a specific patient, a unique material batch, or a single chemical compound). If multiple records belong to the same entity, you must keep all records from that entity together in either the training or test set to prevent data leakage and over-optimistic performance estimates. This ensures you are testing the model's ability to generalize to new, unseen entities [107].
Q4: What is Extrapolated Cross-Validation (ECV), and how does it reduce computational cost for tuning ensemble methods?
ECV is a novel method for efficiently tuning parameters like ensemble size (M) and subsample size (k) in randomized ensembles (e.g., bagging, random forests). Instead of directly fitting and evaluating ensembles of all possible sizes—a computationally expensive process—ECV builds initial estimators for small ensemble sizes using out-of-bag errors. It then employs a risk extrapolation technique to predict the performance of much larger ensembles [108]. This approach provides statistically consistent risk estimates while "considerably lower[ing]" the computational cost compared to sample-split or K-fold CV, as it avoids fitting an ensemble for every candidate size [108].
Troubleshooting Guides
Problem: Suspected Overfitting in a Small Dataset
Symptoms:
- High training accuracy but significantly lower validation/test accuracy [23] [22].
- A large gap between training and validation loss curves during model training [23].
Diagnosis and Solution Protocol:
Implement a Combined Validation Metric: Move beyond simple K-fold CV. Use a combined metric like the one implemented in the ROBERT software for hyperparameter optimization [74].
- Interpolation Metric: Use a 10-times repeated 5-fold cross-validation (10x 5-fold CV) on the training data.
- Extrapolation Metric: Use a selective sorted 5-fold CV. Sort data by the target value (y), partition it, and use the highest RMSE from the top and bottom partitions.
- Objective Function: Use the combined RMSE from both interpolation and extrapolation tests to guide Bayesian hyperparameter optimization [74].
Apply Robust Regularization:
Evaluate with a Strategic Holdout Set: Reserve an external test set (e.g., 20% of data) split using an "even" distribution method to ensure a balanced representation of target values, preventing bias in the final performance assessment [74].
Problem: Poor Extrapolation Performance
Symptoms:
- Model performs well on internal validation but fails to predict new materials or compounds with properties outside the training range.
- Tree-based models (e.g., Random Forest) are particularly known for poor extrapolation behavior [74].
Diagnosis and Solution Protocol:
Quantify Extrapolation Ability: Integrate a dedicated extrapolation test into your workflow, such as the selective sorted K-fold CV described above [74]. This directly measures performance on out-of-range data.
Algorithm Selection and Tuning:
- Be aware that Random Forests and other tree-based models can struggle with extrapolation [74].
- When extrapolation is critical, consider using algorithms with better inherent extrapolation properties (e.g., linear models or carefully regularized neural networks) or ensure that the chosen validation strategy explicitly optimizes for this goal.
Leverage ECV for Ensembles: If using ensemble methods, the ECV framework provides uniform consistency in risk estimation across ensemble and subsample sizes, which can lead to more robust models that generalize better, including in extrapolation tasks [108].
Problem: High-Variance Performance Estimates in Cross-Validation
Symptoms:
- Significant fluctuation in model performance metrics (e.g., R², RMSE) across different random splits of the data.
- Uncertainty about which model or hyperparameter set to trust.
Diagnosis and Solution Protocol:
Increase CV Repeats: Switch from a single run of K-fold CV to repeated K-fold CV (e.g., 10x 5-fold CV). Repeated splits and averaging over the results provide a more stable and reliable estimate of model performance and reduce the variance of the estimate [74].
Use Stratified Splits: For classification problems, and especially with imbalanced class distributions, use stratified K-fold CV. This ensures each fold has approximately the same proportion of class labels as the whole dataset, leading to less biased performance estimates [109] [107].
Consider Nested Cross-Validation: For a truly unbiased estimate of model performance when both model selection and hyperparameter tuning are required, use nested CV. An inner loop performs hyperparameter tuning, and an outer loop provides the final performance estimate. Be aware that this method comes with high computational cost [107].
Table 1: Benchmarking Model Performance on Small Chemical Datasets (n=18-44 points)
| Dataset | Model Type | 10x 5-Fold CV Performance (Scaled RMSE) | External Test Set Performance (Scaled RMSE) | Key Finding |
|---|---|---|---|---|
| A (Liu) | MVLR | Baseline | Baseline | Non-linear models (NN) can compete with MVLR on small data when properly tuned [74]. |
| Neural Network (NN) | Competitive | Best | ||
| D (Paton) | MVLR | Baseline | Baseline | |
| Neural Network (NN) | Outperformed | Competitive | ||
| F (Doyle) | MVLR | Baseline | Baseline | |
| Neural Network (NN) | Outperformed | Best | ||
| H (Sigman) | MVLR | Baseline | Baseline | |
| Neural Network (NN) | Outperformed | Best |
Table 2: Comparison of Cross-Validation Strategies for Different Scenarios
| Scenario | Recommended CV Strategy | Key Advantage | Practical Consideration |
|---|---|---|---|
| General Purpose / Limited Data | Repeated K-Fold (e.g., 10x 5-Fold) | Reduces variance of performance estimate; makes efficient use of data [74]. | More computationally intensive than single K-fold. |
| Tuning Ensemble Methods | Extrapolated CV (ECV) [108] | Yields near-oracle performance with significantly lower computational cost than K-fold CV. | Requires implementation of risk extrapolation technique. |
| Final Model Evaluation | Nested Cross-Validation [107] | Provides almost unbiased performance estimate when tuning is part of the workflow. | Very high computational cost. |
| Testing Extrapolation | Selective Sorted K-Fold [74] | Directly measures model performance on data outside the training range. | Requires sorted data and specific partitioning. |
Experimental Protocol: Combined Interpolation & Extrapolation Validation Workflow
This protocol is adapted from automated workflows used in chemical informatics for low-data regimes [74].
Objective: To train and select a model that generalizes well for both interpolation and extrapolation tasks on a small dataset (<100 samples).
Step-by-Step Methodology:
Initial Data Partitioning:
- Reserve 20% of the full dataset (or a minimum of 4 data points) as a final, external Test Set. Use an "even split" method (sort by target value
yand select systematically) to ensure this set is representative of the entire target value range. - The remaining 80% is the Development Set.
- Reserve 20% of the full dataset (or a minimum of 4 data points) as a final, external Test Set. Use an "even split" method (sort by target value
Hyperparameter Optimization with Combined Metric:
- Use the Development Set for model training and hyperparameter tuning via Bayesian Optimization.
- The objective function for the optimization is a Combined RMSE calculated as follows:
a. Interpolation RMSE: Perform a 10-times repeated 5-fold cross-validation on the Development Set. Calculate the RMSE.
b. Extrapolation RMSE: Perform a selective sorted 5-fold CV:
- Sort the Development Set by the target variable (
y). - Partition it into 5 folds. - Calculate the RMSE for the fold with the highestyvalues (top partition) and the lowestyvalues (bottom partition). - Use the highest RMSE from these two partitions. c. Combine: The objective value for the Bayesian optimizer is the average of the Interpolation and Extrapolation RMSE values.
Final Model Training and Evaluation:
- Train a final model on the entire Development Set using the best-found hyperparameters.
- Perform the final performance evaluation on the held-out Test Set from Step 1. Report key metrics (e.g., RMSE, R²).
Workflow Visualization
The Scientist's Toolkit: Research Reagent Solutions
Table 3: Essential Computational Tools for Advanced Cross-Validation
| Tool / Solution | Function | Application Context |
|---|---|---|
| ROBERT Software [74] | Automated workflow for low-data regimes. Performs data curation, hyperparameter optimization (with combined interpolation/extrapolation metric), and generates comprehensive reports. | Chemistry, Materials Science. Ideal for benchmarking linear vs. non-linear models on small datasets. |
| ECV (Extrapolated Cross-Validation) [108] | A specialized CV method for efficiently tuning ensemble parameters (size, subsample rate) via risk extrapolation, reducing computational cost. | Any field using bagging, random forests, or other randomized ensembles, especially under computational constraints. |
| Bayesian Optimization Libraries (e.g., scikit-optimize) | Efficiently navigates hyperparameter space to minimize a defined objective function, such as the combined RMSE metric. | General ML; essential for implementing the advanced tuning protocols described above. |
| Stratified K-Fold CV [109] [107] | Resampling technique that preserves the percentage of samples for each class in every fold. | Critical for classification problems with imbalanced datasets to avoid biased performance estimates. |
| Nested Cross-Validation [107] | A method with an inner loop for hyperparameter tuning and an outer loop for performance estimation, preventing optimistic bias. | Provides a robust final performance estimate for a model that required tuning; best for final reporting before deployment. |
FAQs: Addressing Common Research Challenges
Q1: On small datasets, when do non-linear models typically outperform linear models? Non-linear models can outperform linear ones, even on datasets with fewer than 100 samples, particularly when the data contains complex, non-linear relationships that linear models cannot capture [110]. However, this performance is contingent on using rigorous validation to control the higher risk of overfitting, which is more pronounced in flexible non-linear models like Random Forests or Neural Networks when data is scarce [111].
Q2: What is the minimum dataset size needed to reliably use machine learning models? Empirical studies suggest that a minimum of N = 500 data points is required to begin mitigating overfitting. However, for performance metrics to stabilize and converge, larger dataset sizes in the range of N = 750 to 1,500 are often necessary [111]. The exact requirement can vary based on the number of features and model complexity.
Q3: How can I tell if my model is overfitting on a small dataset? The primary indicator is a significant performance gap between training and validation scores. For example, if your training accuracy is high while your validation accuracy is substantially lower, the model is likely overfitting [22] [23]. Other signs include the model performing perfectly on training data but failing on new, unseen data.
Q4: Which evaluation metrics are most reliable for small dataset benchmarking? For binary classification on small datasets, the Matthews Correlation Coefficient (MCC) is recommended as it exhibits the lowest bias and is robust for imbalanced data [112]. A combination of metrics, rather than relying on a single one like accuracy, provides a more complete picture. For regression tasks, common metrics include Mean Absolute Error (MAE), Root Mean Squared Error (RMSE), and R² [113].
Q5: What is the best validation method for a small dataset? Repeated Nested Cross-Validation (rnCV) is considered a robust method for small datasets [112]. It involves an inner loop for hyperparameter tuning and an outer loop for performance evaluation, repeated multiple times with different data splits. This method helps minimize bias and provides a more reliable estimate of a model's ability to generalize.
Troubleshooting Guides
Issue 1: Overfitting Models
Symptoms:
- High performance on training data but poor performance on test/holdout data [22] [23].
- A large gap between training and validation loss (or error) curves [23].
Solutions:
- Increase Data Diversity: Use data augmentation techniques (e.g., flipping, rotating, cropping for images) to artificially expand your dataset [23].
- Apply Regularization: Implement techniques like L1 (Lasso) or L2 (Ridge) regularization, or use Dropout for neural networks to penalize model complexity [22] [23].
- Simplify the Model: Reduce the number of model parameters. For decision trees, use pruning; for neural networks, reduce layers or neurons [22] [23].
- Use Early Stopping: Halt the training process when validation performance stops improving [22] [23].
- Leverage Pre-trained Models: Use models pre-trained on large, general datasets and fine-tune them on your small dataset, which can be more effective than training from scratch [23].
Issue 2: High Variance in Model Performance
Symptoms:
- Model performance changes drastically with different random splits of the data [112].
Solutions:
- Employ Repeated Nested Cross-Validation: This method reduces variance by averaging results over multiple data splits and iterations [112].
- Use a Permutation Test: This non-parametric test helps determine if your model's performance is statistically significant or could have occurred by chance, quantifying the probability that the results will generalize to new data [112].
Issue 3: Choosing Between Linear and Non-Linear Models
Symptoms:
- Uncertainty about which model family is better suited for your specific small dataset.
Solutions:
- Start Simple: Begin with a linear model (e.g., Logistic Regression, Linear Regression) as a baseline. Its performance provides a benchmark [111].
- Benchmark Systematically: Compare your simple baseline against a selection of non-linear models (e.g., SVM, Random Forest, Gradient Boosting) using a rigorous validation method like nested CV [53] [114].
- Prioritize Stable Models: On very small datasets, simpler models (e.g., Naive Bayes) often overfit less than complex ones like Random Forests, which may overestimate performance [111].
Experimental Protocols & Data Presentation
Protocol 1: Rigorous Model Evaluation with Nested Cross-Validation
This protocol is essential for obtaining unbiased performance estimates on small datasets [112].
- Define Outer Loop: Split the entire dataset into k folds (e.g., 5 or 10). For each iteration:
- Reserve one fold as the test set.
- Use the remaining k-1 folds as the development set.
- Define Inner Loop: On the development set, perform another k-fold cross-validation.
- For each hyperparameter combination, train the model on k-1 folds of the development set and validate on the held-out fold.
- Identify the best-performing hyperparameters.
- Train and Test: Train a final model on the entire development set using the best hyperparameters. Evaluate this model on the outer loop's test set.
- Repeat: Repeat the entire process multiple times with different random seeds for the data splits (Repeated Nested CV) to average out variability [112].
Protocol 2: Permutation Test for Significance
Use this test to validate that your model has learned meaningful patterns and its performance is not due to chance [112].
- Train your model on the dataset and compute the performance score (e.g., accuracy, MCC) on a held-out test set. This is the real score.
- Randomly shuffle the labels (the target variable) of your dataset to break the relationship between features and the outcome.
- Retrain the model on this shuffled dataset and compute a new performance score. This is a permutation score.
- Repeat steps 2 and 3 many times (e.g., 1000) to build a distribution of permutation scores.
- Calculate the p-value as the proportion of permutation scores that are greater than or equal to the real score. A small p-value (e.g., < 0.05) indicates that the real model's performance is likely genuine.
Performance Comparison Table
The table below summarizes findings from various studies on model performance with limited data.
| Model Type | Example Algorithms | Typical Performance on Small Datasets (N < 500) | Key Considerations & Risks |
|---|---|---|---|
| Linear | Logistic Regression, Linear Regression, ARIMA [114] | Stable but may be inaccurate if data has non-linear patterns [53] [111]. | Lower risk of overfitting; good baseline model [111]. |
| Non-Linear | SVM, Random Forest, Neural Networks | Can be superior, even for N < 100, but high risk of overfitting [110] [111]. | Prone to overfitting; requires rigorous validation (e.g., nested CV) [111]. |
| Tree-Based (Gradient Boosting) | LightGBM, adaBoost | Often works well with small data; good predictive power [110] [111]. | Requires careful hyperparameter tuning to avoid overfitting [110]. |
The Scientist's Toolkit: Essential Research Reagents
This table lists key computational "reagents" and their functions for benchmarking studies.
| Item | Function / Explanation | Relevance to Small Datasets |
|---|---|---|
| Repeated Nested Cross-Validation | A validation method that provides a nearly unbiased estimate of model generalization error by nesting hyperparameter tuning inside the evaluation loop and repeating the process [112]. | Crucial for reducing bias and variance in performance estimates on small data [112]. |
| Matthews Correlation Coefficient (MCC) | A performance metric for binary classification that is robust to class imbalance [112]. | Recommended as a primary metric when both classes are equally important, as it exhibits low bias on small datasets [112]. |
| Permutation Test | A statistical test that calculates the probability of obtaining a given result by random chance by shuffling labels [112]. | Provides a p-value-like measure to confirm that model performance is significant and not a artifact of the small sample size [112]. |
| Data Augmentation | Techniques to artificially increase the size and diversity of a training dataset by creating modified versions of existing data points [23]. | Directly addresses the core problem of limited data, helping to prevent overfitting and improve generalization [23]. |
| Automated ML (AutoML) Libraries | Software tools (e.g., AutoGluon, mljar) that automate the process of model selection and hyperparameter tuning [110]. | Can be highly effective for achieving strong predictive power but require sufficient computation time to perform well on small datasets [110]. |
In the rapidly evolving domain of machine learning, and particularly in specialized fields like materials science and drug development, ensuring model generalizability remains a quintessential challenge. Overfitting occurs when a model performs well on training data but fails to generalize to unseen data, representing a significant threat to research validity and practical application. This problem is especially acute when working with small, specialized datasets common in experimental sciences where data collection is expensive or time-consuming. This guide provides researchers with practical methodologies to quantitatively assess and mitigate overfitting, ensuring more reliable and reproducible results in their experiments.
Understanding and Quantifying Overfitting
What is Overfitting? Formal Definitions
- Training Data Error: The error of a model M on the training data used to derive M [115].
- True Generalization Error: The error of model M on the entire population or distribution from which training data were sampled [115].
- Estimated Generalization Error: The estimated error (via an error estimator procedure) of M on the population distribution [115].
An overfitted model accurately represents the training data but fails to generalize well to new data sampled from the same distribution because some learned patterns are idiosyncratic to the training sample rather than representative of the underlying population [115].
The Overfitting Index (OI): A Novel Metric
The Overfitting Index (OI) is a recently developed metric designed to quantitatively assess a model's tendency to overfit [116]. Through extensive experiments on datasets including Breast Ultrasound Images (BUSI) and MNIST using architectures such as MobileNet, U-Net, ResNet, Darknet, and ViT-32, the OI has demonstrated utility in discerning variable overfitting behaviors across different architectures and highlighting the mitigative effect of data augmentation, especially on smaller, specialized datasets [116].
Essential Methodologies for Detection and Measurement
Data Splitting Strategies for Robust Evaluation
Hold-Out Validation Split your dataset into training and testing sets, with a common ratio being 80% for training and 20% for testing [84]. The model should perform well on both sets to demonstrate generalization capability.
K-Fold Cross-Validation Split your dataset into k groups (k-fold cross-validation). Use one group as the testing set and the others for training, repeating this process until each group has served as the testing set [84]. This approach allows all data to eventually be used for training while providing robust generalization estimates.
Critical Consideration for Small Datasets With small datasets in materials science research, reserve a small holdout test set (even 10-20% of the data) for final evaluation to simulate real-world performance [13].
Monitoring Training Dynamics
Learning Curve Analysis Plot training and validation loss/metrics across training epochs. A diverging pattern where training performance continues to improve while validation performance deteriorates indicates overfitting.
Early Stopping Implementation Monitor validation loss during training and halt when validation performance plateaus or begins to degrade, saving the optimal model for generalization [84].
Diagram: Early Stopping Workflow for Preventing Overfitting
Quantitative Framework: Metrics and Scores
Performance Gaps as Overfitting Indicators
The performance differential between training and validation/test sets provides the most direct evidence of overfitting. Monitor these key metrics:
Primary Performance Gaps
- Training vs. Validation Accuracy Differential
- Training vs. Validation Loss Differential
- Training vs. Test Set Performance Metrics
Thresholds for Concern While context-dependent, general guidelines suggest investigating potential overfitting when:
- Training accuracy exceeds validation accuracy by >5-10%
- Training loss continues decreasing while validation loss plateaus or increases
- Performance on unseen data is significantly lower than training performance
Advanced Statistical Measures
Regularization-Based Diagnostics L1/L2 regularization techniques not only prevent overfitting but can serve as diagnostic tools. Monitor weight magnitudes and distributions throughout training [84].
Complexity-Validation Tradeoff Analysis Evaluate multiple models of varying complexity and plot the relationship between model complexity and validation performance to identify the optimal balance point [115].
Prevention and Mitigation Strategies
Data-Centric Approaches
Data Augmentation Artificially expand your dataset by creating modified versions of existing samples. For materials science data, this might include image transformations (rotations, flips, rescaling) or synthetic data generation techniques appropriate to your domain [13] [84].
Feature Selection With limited training samples and many features, select only the most important features to prevent overfitting. Use mutual information scoring, LASSO regression, or domain knowledge to focus the model on meaningful signals [13].
Model-Centric Approaches
Regularization Techniques
- L1/L2 Regularization: Add penalty terms to the cost function to push estimated coefficients toward zero [84].
- Dropout: Randomly disable neurons during training to force the network to generalize [13].
Architecture Simplification Reduce model complexity by removing layers or decreasing the number of neurons in fully-connected layers to find the optimal balance between underfitting and overfitting [84].
Transfer Learning Leverage pre-trained models (e.g., ResNet for images) fine-tuned on your small dataset. This approach capitalizes on general features learned from large datasets, reducing the need for extensive training data [13].
Special Considerations for Small Datasets
The High-Dimensionality Challenge
In domains with high-dimensional data (many features) and small sample sizes—common in genomics, materials characterization, and drug discovery—overfitting is a particularly critical danger [115]. Specialized protocols are required:
Nested Cross-Validation Implement fully nested cross-validation where feature selection occurs only on training folds, not the entire dataset, to prevent biased error estimates [115].
Dimensionality Reduction Apply Principal Component Analysis (PCA), t-SNE, or domain-specific dimensionality reduction techniques before model training to mitigate the curse of dimensionality.
Protocol Comparison for Small Datasets
Table: Error Estimation Protocols and Their Biases in High-Dimensional Settings [115]
| Protocol | Description | Bias Level | When to Use |
|---|---|---|---|
| Biased Resubstitution | Gene selection and error estimation on all data | High (Severely optimistic) | Not recommended |
| Partial Cross-Validation | Feature selection on all data, then train/test split | Moderate | Limited data scenarios |
| Full Cross-Validation | Feature selection only on training portions | Low (Nearly unbiased) | Recommended for small datasets |
Experimental Protocols for Materials Science Research
Standardized Evaluation Workflow
Phase 1: Baseline Establishment
- Implement multiple model architectures with minimal regularization
- Establish performance baselines on training and validation splits
- Calculate initial overfitting metrics and performance gaps
Phase 2: Mitigation Implementation
- Apply appropriate regularization techniques based on observed overfitting
- Implement data augmentation strategies relevant to materials data
- Optimize model complexity through architecture search
Phase 3: Validation and Reporting
- Evaluate final model on completely held-out test set
- Calculate Overfitting Index and related metrics
- Document all mitigation strategies and their effects
Diagram: Comprehensive Overfitting Assessment Protocol
Frequently Asked Questions (FAQs)
Q1: How can I detect overfitting with very small datasets where I can't afford a large test set? A: With small datasets, use k-fold cross-validation to maximize data usage while maintaining reliable evaluation. Consider leave-one-out cross-validation for extremely small datasets, and focus on performance consistency across folds rather than absolute performance metrics.
Q2: Is some degree of overfitting always bad? A: Minor overfitting may be acceptable depending on application context, but significant overfitting indicates models that will fail in practical deployment. The tolerance depends on how the model will be used and the consequences of failure.
Q3: How does the Overfitting Index differ from simple train-test performance gaps? A: The OI provides a standardized, normalized metric that enables comparison across different models and datasets, while raw performance gaps are highly dependent on specific dataset characteristics and metrics [116].
Q4: Can we overfit the validation set? A: Yes, through repeated model selection and hyperparameter tuning based on validation performance, models can indirectly learn patterns specific to the validation set. This is why a completely held-out test set is essential for final evaluation [117].
Q5: What are the most effective techniques for small datasets in materials science? A: Transfer learning, rigorous regularization, data augmentation specific to materials data (such as synthetic microstructure generation), and ensemble methods typically provide the most benefit for small datasets in this domain [13].
Research Reagent Solutions: Essential Tools
Table: Essential Computational Tools for Overfitting Assessment and Mitigation
| Tool/Category | Function | Application Context |
|---|---|---|
| Regularization (L1/L2) | Constrains model complexity by penalizing large weights | Prevents overfitting in regression and classification models [84] |
| Dropout | Randomly disables neurons during training | Reduces interdependent learning in neural networks [13] |
| Data Augmentation | Artificially expands dataset through transformations | Increases effective dataset size; domain-specific implementations needed [13] |
| Cross-Validation | Statistical technique for robust performance estimation | Provides more reliable error estimates with limited data [84] |
| Early Stopping | Halts training when validation performance plateaus | Prevents overtraining in iterative learning algorithms [84] |
| Feature Selection | Identifies most relevant features for modeling | Reduces dimensionality; focuses model on meaningful signals [13] |
| Transfer Learning | Leverages pre-trained models adapted to new tasks | Effective for small datasets by utilizing pre-learned features [13] |
Effectively quantifying and mitigating overfitting is essential for developing reliable machine learning models, particularly when working with the small, specialized datasets common in materials science and drug development research. By implementing the metrics, methodologies, and mitigation strategies outlined in this guide, researchers can significantly improve model generalizability and ensure their findings translate successfully to real-world applications. The systematic approach to measuring the Overfitting Index and related metrics provides a standardized framework for evaluating generalization capability across different model architectures and experimental conditions.
Troubleshooting Guide: SHAP and ICE Plots in Small Data Environments
Common Issues and Solutions
| Problem Category | Specific Symptoms | Likely Causes | Recommended Solutions | Related Technique |
|---|---|---|---|---|
| SHAP Value Instability | Large variations in feature importance rankings between similar models; inconsistent explanations for comparable data points. | High variance in small datasets; correlated features affecting Shapley value calculation; insufficient background data distribution sampling [118]. | Increase nsamples parameter in KernelExplainer; use the same background dataset across explanations; apply feature selection to reduce dimensionality [3] [13]. |
SHAP |
| ICE Plot Overplotting | Visual clutter makes it impossible to discern individual conditional expectation lines; patterns obscured by too many lines. | Too many instances plotted simultaneously; high density of data points in certain feature ranges [119]. | Use alpha blending for transparency; plot a stratified random subset of instances; implement clustering to show representative ICE lines [119]. | ICE Plots |
| Computational Bottlenecks | SHAP value calculation takes impractically long; memory issues when explaining large feature sets. | Combinatorial complexity of Shapley values; large background data size; high-dimensional feature space [120] [121]. | Use model-specific optimizations (TreeSHAP, DeepSHAP); reduce background dataset size strategically; sample features for approximate explanations [121] [122]. | SHAP |
| Misleading Interpretations | SHAP/ICE results contradict domain knowledge; feature effects seem biologically/physically implausible. | Data leakage in training; hidden confounding variables; model overfitting to spurious correlations [123]. | Validate against partial dependence plots; conduct sensitivity analysis with domain experts; check for train-test contamination [123] [124]. | SHAP & PDP |
| Small Data Overfitting | Models perform well on training data but poorly on validation; SHAP shows complex, unlikely feature interactions. | Insufficient training examples; high model complexity relative to data size; inadequate regularization [3] [13]. | Implement rigorous cross-validation; use simpler interpretable models; apply transfer learning from larger datasets [3] [13]. | Model Validation |
Frequently Asked Questions
SHAP Analysis Fundamentals
Q: What are the core mathematical properties that make SHAP values suitable for scientific validation?
A: SHAP values are based on Shapley values from cooperative game theory and provide four key guarantees: (1) Efficiency - the sum of all feature contributions equals the model's prediction minus the average prediction, (2) Symmetry - if two features contribute equally to all coalitions, they receive the same Shapley value, (3) Dummy - a feature that doesn't change the prediction gets a zero Shapley value, and (4) Additivity - the combined effect of multiple models can be decomposed [120]. These properties ensure consistent, mathematically grounded explanations.
Q: How do I choose between SHAP and ICE plots for model validation in materials science research?
A: Use SHAP when you need both global feature importance rankings and local instance-level explanations, particularly when you need to understand how different features interact to produce specific predictions [120] [121]. Use ICE plots when you need to visualize the functional relationship between a specific feature and the model's predictions across its range, and when you need to identify heterogeneous relationships that affect different subgroups of your materials dataset differently [119]. For comprehensive validation, use both techniques complementarily.
Implementation Challenges
Q: Why do my SHAP values show unexpectedly high importance for features that domain experts consider irrelevant?
A: This can indicate several issues: (1) Data leakage - the feature may be correlating with the target through confounding variables, (2) Model overfitting - especially problematic with small datasets where models can latch onto spurious correlations [3], (3) Feature correlation - SHAP can assign importance to correlated features in unintuitive ways [118]. Investigate by checking feature relationships in your data, validating with domain knowledge, and testing model performance on holdout sets with these features removed [123].
Q: How can I reliably compute SHAP values for small materials datasets without introducing bias?
A: For small datasets (n < 1000): (1) Use the entire dataset as the background distribution rather than sampling, (2) Prefer TreeSHAP for tree-based models or LinearSHAP for linear models for exact computations, (3) For complex models, use KernelSHAP with increased nsamples (500-1000) despite computational cost, (4) Validate stability through multiple runs with different random seeds, and (5) Consider using interpretable-by-design models like linear models or GAMs when SHAP computation is too unstable [3] [121] [13].
Experimental Protocols for Method Validation
Protocol 1: Comparative SHAP Analysis for Model Selection
Objective: Select the most appropriate model for small materials datasets by evaluating not just predictive performance but also explanation plausibility.
Materials Dataset Requirements:
- Minimum of 50 samples per feature for regression tasks
- Stratified sampling for classification to maintain class balance
- Documented domain knowledge about expected feature relationships
Procedure:
- Train multiple candidate models (linear, random forest, XGBoost, etc.) with appropriate regularization for small data
- Compute SHAP values for each model using consistent background data (recommended: 100 representative samples)
- Generate following diagnostics for comparison:
- Feature importance consistency: Rank correlation of global SHAP importance across models
- Explanation stability: Variance in local SHAP values for key instances
- Domain alignment: Expert evaluation of top feature explanations
Validation Metrics:
Protocol 2: ICE-Based Detection of Heterogeneous Relationships
Objective: Identify when feature effects differ across subgroups in materials data, which is critical for understanding composition-property relationships.
Procedure:
- Select feature of interest based on domain importance or preliminary SHAP analysis
- Generate ICE plots for all instances in the dataset
- Apply clustering to ICE curves to identify distinct response patterns
- Correlate cluster membership with materials characteristics (e.g., composition, processing history)
- Validate heterogeneous effects through statistical tests between clusters
Interpretation Framework:
- Parallel ICE curves: Consistent feature effect across dataset
- Diverging patterns: Presence of effect modifiers or interactions
- Crossing patterns: Opposing effects in different subgroups
Experimental Workflow Visualization
SHAP-ICE Validation Workflow for Materials Science
SHAP Value Calculation Methodology
The Scientist's Toolkit: Research Reagent Solutions
Essential Software and Computational Tools
| Tool Name | Function | Application in Materials Science | Implementation Considerations |
|---|---|---|---|
| SHAP Python Library | Model-agnostic explanation generation | Explain composition-property relationships in alloys, polymers, etc. [121] [122] | Use TreeExplainer for ensemble methods, KernelExplainer for arbitrary models |
| scikit-learn PDP & ICE | Partial dependence and individual conditional expectation plots | Visualize feature effects in materials property prediction [119] | Available in sklearn.inspection module; compatible with any scikit-learn compatible model |
| InterpretML GAMs | Generalized additive models | Interpretable baseline models for small datasets [121] | Built-in feature interactions detection; good performance with limited data |
| XGBoost/LightGBM | Gradient boosting frameworks | High-performance modeling with built-in SHAP support [121] [122] | Use max_depth 3-5 and increase regularization for small datasets |
| Cross-validation Strategies | Model performance validation | Reliable error estimation with limited samples [3] [13] | Nested CV for hyperparameter tuning; stratified splits for classification |
Experimental Design Reagents
| Methodology Component | Purpose | Small Data Adaptation |
|---|---|---|
| Background Distribution (SHAP) | Reference for expectation calculations | Use entire dataset rather than sampling; consider k-means clustering for compression [121] |
| Feature Selection | Reduce dimensionality to prevent overfitting | Domain-knowledge guided selection; stability selection with high thresholds [3] |
| Regularization Parameters | Control model complexity | Increase L1/L2 regularization; stronger pruning for tree-based models [13] |
| Statistical Power Analysis | Determine minimum sample size | Estimate detectable effect sizes from pilot studies; use conservative power (0.8-0.9) |
| Domain Expert Validation | Assess explanation plausibility | Structured rating scales for feature importance; iterative refinement cycles [123] |
# Technical Support Center
This guide provides troubleshooting support for researchers applying Active Learning (AL) strategies with Automated Machine Learning (AutoML) to mitigate overfitting in small-sample materials science datasets.
## Frequently Asked Questions (FAQs)
Q1: My AL model's performance has plateaued despite adding new data. What could be the cause? This is a common issue where the Active Learning strategy is no longer selecting informative samples. In the early stages of data acquisition, uncertainty-driven strategies (like LCMD or Tree-based-R) and diversity-hybrid strategies (like RD-GS) are most effective. However, as the labeled set grows, the marginal gain from each new sample decreases, and all strategies tend to converge in performance [35]. If you observe early plateauing, consider switching your query strategy. Furthermore, ensure your AutoML optimizer is robust to model drift, as the surrogate model can switch between model families (e.g., from linear regressors to tree-based ensembles) during the iterative process, which can affect sample selection [35].
Q2: How do I choose the best AL strategy at the start of a project with very little labeled data? Benchmark studies indicate that when data is extremely scarce, you should prioritize uncertainty-based or diversity-hybrid strategies [35]. These have been shown to outperform random sampling and geometry-only heuristics in the initial acquisition phases. Starting with a strategy like RD-GS (a diversity-hybrid method) can help select more informative initial samples, leading to faster model improvement and helping to mitigate overfitting from the outset [35].
Q3: What is the minimum initial dataset size required to start an AL cycle effectively? While the exact size depends on your specific dataset's complexity, the benchmark methodology involves starting with a small, randomly sampled initial labeled set (denoted as (n_{init})) [35]. The key is to ensure this initial set is representative. The AutoML framework, with its internal 5-fold cross-validation, helps provide robust performance estimates even from these small starting points, guiding the AL strategy effectively from the first iteration [35].
Q4: How can I validate that my AL/AutoML pipeline is not overfitting to the small training set? The recommended practice within an AutoML workflow is to use a robust validation method like 5-fold cross-validation during the model fitting process at each AL step [35]. This internal validation provides a more reliable estimate of model generalizability than a single train-test split. Additionally, you should maintain a completely held-out test set (e.g., a 80:20 training-test split) to evaluate the model's final performance after the AL cycles are complete [35].
## Troubleshooting Guides
Problem: High Variance in Model Performance Between Active Learning Cycles
- Symptoms: The model's performance (e.g., MAE or R²) fluctuates significantly with each new batch of samples added, rather than showing a stable improvement.
- Possible Causes:
- The AL query strategy is too greedy, selecting outliers or noisy samples.
- The initial labeled set (L) is too small or not representative of the data pool (U).
- The AutoML's model selection is unstable between cycles.
- Solutions:
- Switch from a pure uncertainty-based strategy to a hybrid strategy that also considers diversity or representativeness to ensure a more balanced batch of samples [35].
- Increase the size of the initial random sample (n_{init}) to create a more stable starting point for the model.
- Review the AutoML configuration. Increasing the number of cross-validation folds or constraining the search space to more stable model families in early cycles can help reduce variance.
Problem: Active Learning Performs No Better Than Random Sampling
- Symptoms: The performance curve of your AL strategy is nearly identical to that of a random sampling baseline.
- Possible Causes:
- The surrogate model's uncertainty estimates are unreliable.
- The data pool does not contain significantly more informative samples.
- Using a suboptimal AL strategy for the data characteristics.
- Solutions:
- In an AutoML context, ensure the optimizer is considering models capable of providing good uncertainty estimates (e.g., tree-based ensembles). Techniques like Monte Carlo Dropout can be used if neural networks are selected [35].
- Audit your data pool. If it is highly homogeneous, the benefits of AL will be limited.
- Consult the performance benchmark and switch to a strategy proven to be effective early on, such as LCMD (uncertainty-based) or RD-GS (diversity-hybrid) [35].
## Experimental Protocols & Data
Methodology: Benchmarking AL Strategies in AutoML [35] The following protocol outlines the standardized evaluation framework used to compare the performance of different mitigation strategies.
- 1. Data Setup: Begin with a dataset split into an unlabeled pool (U) and a small initial labeled set (L). A standard 80:20 train-test split is performed, and the test set is held out for final evaluation.
- 2. Initialization: Randomly sample (n_{init}) instances from (U) to form the initial (L).
- 3. Iterative Active Learning Cycle: a. Model Training & Validation: An AutoML model is fitted on the current (L). Model performance and hyperparameter tuning are validated internally using 5-fold cross-validation. b. Sample Selection: A pre-defined AL strategy (e.g., uncertainty, diversity) queries the single most informative sample (x^) from (U). c. Annotation: The queried sample (x^) is labeled (e.g., via simulation or experiment) to obtain its target value (y^). d. Dataset Update: The newly labeled sample ((x^, y^*)) is added to (L) and removed from (U).
- 4. Performance Tracking: The model's performance on the held-out test set is recorded. Steps 3a-3d are repeated until a stopping criterion (e.g., budget exhaustion) is met.
- 5. Comparison: Performance metrics (MAE, R²) for all AL strategies are plotted against the number of acquired samples and compared to a random sampling baseline.
Quantitative Performance of AL Strategies [35] The table below summarizes the comparative performance of different AL strategy types in small-sample regression tasks for materials science.
Table 1: Comparative Performance of Active Learning Strategies
| Strategy Type | Key Principles | Example Strategies | Early-Stage Performance (Data-Scarce) | Late-Stage Performance (Data-Rich) | Key Characteristics |
|---|---|---|---|---|---|
| Uncertainty-Driven | Queries samples where model prediction is most uncertain. | LCMD, Tree-based-R [35] | Clearly outperforms random sampling [35]. | Converges with other methods [35]. | Highly effective for initial learning; relies on good uncertainty estimation. |
| Diversity-Hybrid | Selects samples that are both informative and diverse. | RD-GS [35] | Clearly outperforms random sampling [35]. | Converges with other methods [35]. | Balances exploration and exploitation; robust choice for various stages. |
| Geometry-Only | Selects samples based on data distribution geometry. | GSx, EGAL [35] | Outperformed by uncertainty and hybrid methods [35]. | Converges with other methods [35]. | May select less informative samples when data is very scarce. |
| Random Baseline | Selects samples randomly from the pool. | Random-Sampling [35] | Serves as a baseline for comparison [35]. | Converges with other methods [35]. | Useful for validating that an AL strategy provides a benefit. |
## Research Reagent Solutions
Table 2: Essential Components for an AL/AutoML Pipeline
| Item | Function in the Experiment |
|---|---|
| AutoML Framework | Automates the selection of machine learning models and their hyperparameters, reducing manual tuning and mitigating overfitting through robust validation [35]. |
| Pool-based AL Setup | Defines the framework with a labeled set (L) and a large pool of unlabeled data (U), from which informative samples are iteratively selected [35]. |
| Uncertainty Estimation Method | A technique (e.g., Monte Carlo Dropout, predictive variance) that allows the regression model to identify data points where its prediction is uncertain, guiding the AL query [35]. |
| Cross-Validation | A resampling procedure (e.g., 5-fold) used within the AutoML process to reliably estimate model performance and generalization, crucial for preventing overfitting [35]. |
| Stopping Criterion | A predefined rule (e.g., performance plateau, budget limit) to terminate the AL cycle, preventing unnecessary data acquisition and computational cost [35]. |
## Workflow Visualization
The following diagram illustrates the iterative workflow of integrating Active Learning with an AutoML framework for materials science research.
Conclusion
Mitigating overfitting in small materials science datasets is not a single-step solution but a holistic process that integrates data, algorithmic, and strategic interventions. The key takeaways emphasize that data augmentation through generative models, careful algorithm selection with robust hyperparameter tuning, and the incorporation of domain knowledge are paramount for success. Rigorous validation that tests both interpolation and extrapolation performance is essential for trusting model predictions. For the future, these strategies are crucial for unlocking the full potential of ML in high-stakes applications like drug development and biomedical research, where data is often scarce but the cost of model failure is high. The continued development of automated, interpretable, and data-efficient workflows will be central to building reliable, generalizable models that can truly accelerate scientific discovery and clinical translation.
References
- 1. Overfitting - Wikipedia [https://en.wikipedia.org/wiki/Overfitting]
- 2. Overfitting, Model Tuning, and Evaluation of Prediction ... - NCBI [https://www.ncbi.nlm.nih.gov/books/NBK583970/]
- 3. Small data machine learning in materials science [https://www.nature.com/articles/s41524-023-01000-z]
- 4. Prevent overfitting and imbalanced data with Automated ML [https://learn.microsoft.com/en-us/azure/machine-learning/concept-manage-ml-pitfalls?view=azureml-api-2]
- 5. Overfitting In Academic Research [https://www.meegle.com/en_us/topics/overfitting/overfitting-in-academic-research]
- 6. Machine Learning Methods for Small Data Challenges in ... [https://pmc.ncbi.nlm.nih.gov/articles/PMC10999174/]
- 7. How do you handle overfitting in small datasets? [https://zilliz.com/ai-faq/how-do-you-handle-overfitting-in-small-datasets]
- 8. machine learning - How can less amount of data lead to overfitting? - Stack Overflow [https://stackoverflow.com/questions/56520879/how-can-less-amount-of-data-lead-to-overfitting]
- 9. Understanding Overfitting: Strategies and Solutions [http://www.lyzr.ai/glossaries/overfitting/]
- 10. AI for Scientific Discovery is a Social Problem [https://arxiv.org/html/2509.06580v1]
- 11. The Future of Artificial Intelligence in the Face of Data ... [https://www.sciencedirect.com/org/science/article/pii/S1546221825005375]
- 12. Synthetic Data in AI: Solving Data Scarcity and Privacy ... [https://medium.com/@hybrid.minds/synthetic-data-in-ai-solving-data-scarcity-and-privacy-challenges-824d8a380c10]
- 13. How do you handle overfitting in small datasets? [https://milvus.io/ai-quick-reference/how-do-you-handle-overfitting-in-small-datasets]
- 14. [2502.15466] Mitigating in Time Series Analysis... Data Scarcity [https://arxiv.org/abs/2502.15466]
- 15. How do you prevent in deep learning with small datasets? [https://medium.com/@sharetonschool/how-do-you-prevent-in-deep-learning-with-small-datasets-745acb036f71]
- 16. Ithy - Understanding Regularization in Small Datasets [https://ithy.com/article/regularization-small-data-jdlpcp3e]
- 17. GitHub - FernandoDeMeer/ Mitigating - Overfitting - Experiment ... [https://github.com/FernandoDeMeer/Mitigating-Overfitting-Experiment]
- 18. 10 Tips to Diagnose Overfitting in Your Data Errors [https://www.numberanalytics.com/blog/10-tips-diagnose-overfitting]
- 19. Overfitting in Machine Learning Explained [https://aws.amazon.com/what-is/overfitting/]
- 20. What is Overfitting? | IBM [https://www.ibm.com/think/topics/overfitting]
- 21. I tried a bunch of things: The dangers of unexpected ... [https://www.sciencedirect.com/science/article/abs/pii/S0149763420305868]
- 22. Underfitting vs. Overfitting in Machine Learning [https://www.ayadata.ai/a-guide-to-overfitting-and-underfitting-in-machine-learning/]
- 23. Overfitting? Prevent it in Computer Vision [https://www.ultralytics.com/blog/what-is-overfitting-in-computer-vision-how-to-prevent-it]
- 24. Training | Deeplearning4j Troubleshooting [https://deeplearning4j.konduit.ai/deeplearning4j/how-to-guides/tuning-and-training/troubleshooting-training]
- 25. What is Bias-Variance Tradeoff? [https://www.ibm.com/think/topics/bias-variance-tradeoff]
- 26. Bias-Variance Trade Off - Machine Learning [https://www.geeksforgeeks.org/machine-learning/ml-bias-variance-trade-off/]
- 27. Bias–variance tradeoff [https://en.wikipedia.org/wiki/Bias%E2%80%93variance_tradeoff]
- 28. Bias Variance Tradeoff - MLU-Explain [https://mlu-explain.github.io/bias-variance/]
- 29. Machine learning models and over-fitting considerations [https://pmc.ncbi.nlm.nih.gov/articles/PMC8905023/]
- 30. Explainable machine learning in materials science [https://www.nature.com/articles/s41524-022-00884-7]
- 31. A History-Based Approach to Mitigate Overfitting [https://arxiv.org/html/2401.10359v1]
- 32. 8 Simple Techniques to Prevent Overfitting [https://medium.com/data-science/8-simple-techniques-to-prevent-overfitting-4d443da2ef7d]
- 33. Practical guidelines for validation of supervised machine ... [https://pmc.ncbi.nlm.nih.gov/articles/PMC12214441/]
- 34. Active learning in materials science with emphasis on ... [https://www.nature.com/articles/s41524-019-0153-8]
- 35. A comprehensive benchmark of active learning strategies ... [https://www.nature.com/articles/s41598-025-24613-4]
- 36. Knowledge-driven learning, optimization, and experimental ... [https://www.sciencedirect.com/science/article/pii/S2666389923002477]
- 37. Advancing LightGBM with data augmentation for predicting ... [https://www.nature.com/articles/s41529-025-00673-9]
- 38. CTGAN: How GANs Finally Learned to Handle Tabular Data [https://medium.com/@kdk199604/ctgan-how-gans-finally-learned-to-handle-tabular-data-ebbfb169c5d8]
- 39. TVAESynthesizer [https://docs.sdv.dev/sdv/single-table-data/modeling/synthesizers/tvaesynthesizer]
- 40. sdv-dev/CTGAN: Conditional GAN for generating synthetic ... [https://github.com/sdv-dev/CTGAN]
- 41. CTGAN - Synthesize tabular data [https://docs.synthetic.ydata.ai/1.2/examples/ctgan_example/]
- 42. An improved SMOTE algorithm for enhanced imbalanced ... [https://www.nature.com/articles/s41598-025-09506-w]
- 43. A theoretical distribution analysis of synthetic minority ... [https://link.springer.com/article/10.1007/s10994-022-06296-4]
- 44. ISMOTE: A More Accurate Alternative for SMOTE [https://link.springer.com/article/10.1007/s11063-024-11695-w]
- 45. Optimal selection of resampling methods for imbalanced data ... [https://journals.plos.org/plosone/article?id=10.1371/journal.pone.0288540]
- 46. Counterfactual synthetic minority oversampling technique [https://www.sciencedirect.com/science/article/pii/S2666764925000062]
- 47. Resampling for imbalaced datasets: should testing set also ... [https://datascience.stackexchange.com/questions/57882/resampling-for-imbalaced-datasets-should-testing-set-also-be-resampled]
- 48. A Resampling Method for Imbalanced Datasets ... [https://www.sciencedirect.com/science/article/pii/S1877050920318676]
- 49. Resampling approaches to handle class imbalance: a review ... [https://journalofbigdata.springeropen.com/articles/10.1186/s40537-025-01119-4]
- 50. Article FLEX-SMOTE: Synthetic over-sampling technique ... [https://www.sciencedirect.com/science/article/pii/S2666389924002320]
- 51. A review of machine learning methods for imbalanced data ... [https://pubs.rsc.org/en/content/articlehtml/2025/sc/d5sc00270b]
- 52. Overfitting In Ensemble Methods [https://www.meegle.com/en_us/topics/overfitting/overfitting-in-ensemble-methods]
- 53. Performance comparison of linear and non-linear feature ... [https://pmc.ncbi.nlm.nih.gov/articles/PMC6428288/]
- 54. Domain adaptation-based multistage ensemble learning ... [https://jfin-swufe.springeropen.com/articles/10.1186/s40854-024-00695-3]
- 55. An Evaluation of Interpretable Machine Learning Models [https://link.springer.com/article/10.1007/s12599-024-00922-2]
- 56. Bias Variance tradeoff in neural networks - Cross Validated [https://stats.stackexchange.com/questions/577846/bias-variance-tradeoff-in-neural-networks]
- 57. Understanding the Bias-Variance Tradeoff in Gradient ... [https://densitylabs.io/blog/understanding-the-bias-variance-tradeoff-in-gradient-boosted-trees]
- 58. Feature Selection Techniques in Machine Learning [https://www.geeksforgeeks.org/machine-learning/feature-selection-techniques-in-machine-learning/]
- 59. How to Mitigate Overfitting by Creating Ensembles [https://www.geeksforgeeks.org/machine-learning/how-to-mitigate-overfitting-by-creating-ensembles/]
- 60. How Can Ensemble Methods Prevent Model Overfitting? [https://www.cohorte.co/blog/how-can-ensemble-methods-prevent-model-overfitting]
- 61. Bagging, Boosting and Stacking: Ensemble Learning in ML ... [https://www.analyticsvidhya.com/blog/2023/01/ensemble-learning-methods-bagging-boosting-and-stacking/]
- 62. Improving machine learning with ensemble learning on ... [https://pmc.ncbi.nlm.nih.gov/articles/PMC10785929/]
- 63. 1.11. Ensembles: Gradient boosting, random forests, ... [https://scikit-learn.org/stable/modules/ensemble.html]
- 64. Naturally-meaningful and efficient descriptors [https://pmc.ncbi.nlm.nih.gov/articles/PMC9644534/]
- 65. Incorporating domain knowledge in deep neural networks ... [https://www.sciencedirect.com/science/article/pii/S0968090X2500018X]
- 66. 4 Methods Overview – Interpretable Machine Learning [https://christophm.github.io/interpretable-ml-book/overview.html]
- 67. Facing & mitigating common challenges when working with ... [https://www.sciencedirect.com/science/article/pii/S1877750324003168]
- 68. Overfitting in active learning [https://datascience.stackexchange.com/questions/97060/overfitting-in-active-learning]
- 69. The present state and challenges of active learning in drug ... [https://pubmed.ncbi.nlm.nih.gov/38642700/]
- 70. A guide for active learning in synergistic drug discovery [https://www.nature.com/articles/s41598-025-85600-3]
- 71. Cross-property deep transfer learning framework for ... [https://www.nature.com/articles/s41467-021-26921-5]
- 72. Knowledge-reused transfer learning for molecular and ... [https://www.sciencedirect.com/science/article/pii/S2095495624004145]
- 73. Active-learning strategies in computer-assisted drug ... [https://www.sciencedirect.com/science/article/pii/S1359644614004735]
- 74. Machine learning workflows beyond linear models in low-data ... [https://pubs.rsc.org/en/content/articlehtml/2025/sc/d5sc00996k]
- 75. Hyperparameter Tuning [https://www.geeksforgeeks.org/machine-learning/hyperparameter-tuning/]
- 76. A Conceptual Explanation of Bayesian Hyperparameter ... [https://medium.com/data-science/a-conceptual-explanation-of-bayesian-model-based-hyperparameter-optimization-for-machine-learning-b8172278050f]
- 77. How to avoid overfitting bias when both hyperparameter ... [https://stats.stackexchange.com/questions/494900/how-to-avoid-overfitting-bias-when-both-hyperparameter-tuning-and-model-selectin]
- 78. Three Essential Hyperparameter Tuning Techniques for ... [https://towardsdatascience.com/three-essential-hyperparameter-tuning-techniques-for-better-machine-learning-models/]
- 79. A Novel Bayesian Optimization-Based Machine Learning ... [https://pmc.ncbi.nlm.nih.gov/articles/PMC8545233/]
- 80. L1, L2, Dropout, Data Augmentation, and Early Stopping. [https://medium.com/@o.ankeli/understanding-regularization-techniques-in-machine-learning-l1-l2-dropout-data-augmentation-7a8f61b95e8f]
- 81. A Comprehensive Guide to Regularization in Machine ... [https://medium.com/@juanc.olamendy/a-comprehensive-guide-to-regularization-in-machine-learning-9d1243002c50]
- 82. Understanding Regularization Techniques: L1, L2, Dropout ... [https://www.linkedin.com/pulse/understanding-regularization-techniques-l1-l2-dropout-joshua-cox-aiguc]
- 83. Regularization in Neural Networks [https://www.pinecone.io/learn/regularization-in-neural-networks/]
- 84. 8 Simple Techniques to Prevent Overfitting [https://towardsdatascience.com/8-simple-techniques-to-prevent-overfitting-4d443da2ef7d/]
- 85. What is Dimensionality Reduction? [https://www.ibm.com/think/topics/dimensionality-reduction]
- 86. Introduction to Dimensionality Reduction [https://www.geeksforgeeks.org/machine-learning/dimensionality-reduction/]
- 87. Top 12 Dimensionality Reduction Techniques for Machine ... [https://encord.com/blog/dimentionality-reduction-techniques-machine-learning/]
- 88. Understanding Feature Selection Techniques in Machine ... [https://businessanalyticsinstitute.com/understanding-feature-selection-techniques-in-machine-learning/]
- 89. Feature engineering with clinical expert knowledge: A case ... [https://pmc.ncbi.nlm.nih.gov/articles/PMC7179831/]
- 90. Class-imbalanced datasets | Machine Learning [https://developers.google.com/machine-learning/crash-course/overfitting/imbalanced-datasets]
- 91. A comprehensive evaluation of oversampling techniques ... [https://www.nature.com/articles/s41598-025-05791-7]
- 92. What Is Undersampling? [https://www.mastersindatascience.org/learning/statistics-data-science/undersampling/]
- 93. MCSMOTE: A transition matrix-driven oversampling ... [https://www.sciencedirect.com/science/article/abs/pii/S1568494625012190]
- 94. Should You Use Imbalanced-Learn in 2025? [https://www.blog.trainindata.com/should-you-use-imbalanced-learn-in-2025/]
- 95. Undersampling method based on minority class density for ... [https://www.sciencedirect.com/science/article/abs/pii/S0957417424001933]
- 96. Performance analysis of cost-sensitive learning methods ... [https://www.sciencedirect.com/science/article/pii/S235291482100174X]
- 97. Cost-sensitive machine learning [https://en.wikipedia.org/wiki/Cost-sensitive_machine_learning]
- 98. Accurate predictions on small data with a tabular ... [https://www.nature.com/articles/s41586-024-08328-6]
- 99. Machine learning-driven property prediction for materials in ... [https://www.sciencedirect.com/science/article/abs/pii/S0927025625004355]
- 100. MatWheel: Addressing Data Scarcity in Materials Science ... [https://arxiv.org/abs/2504.09152]
- 101. Top 11 Data Automation Tools in 2025 | Estuary [https://estuary.dev/blog/data-automation-tools/]
- 102. Best AI Applications for Workflow Automation in 2025 [https://colorwhistle.com/ai-workflow-automation-applications/]
- 103. Top 10 Open-Source Workflow Automation Software in 2025 [https://www.activepieces.com/blog/top-10-open-source-workflow-automation-tools-in-2024]
- 104. Top 21 AI Workflow Tools in 2025 for Faster Automation - Kuse [https://www.kuse.ai/blog/insight/top-21-ai-workflow-tools-in-2025-for-faster-automation]
- 105. Top 14 Low-Code Automation Tools in 2025 [https://www.browserstack.com/guide/low-code-automation-tools]
- 106. Using and understanding cross-validation strategies ... [https://pmc.ncbi.nlm.nih.gov/articles/PMC5441396/]
- 107. Practical Considerations and Applied Examples of Cross ... [https://ai.jmir.org/2023/1/e49023]
- 108. Extrapolated cross-validation for randomized ensembles - PMC [https://pmc.ncbi.nlm.nih.gov/articles/PMC11492369/]
- 109. Cross-validation (statistics) [https://en.wikipedia.org/wiki/Cross-validation_(statistics)]
- 110. sergeyf/SmallDataBenchmarks: Small Dataset Benchmarks ... [https://github.com/sergeyf/SmallDataBenchmarks]
- 111. Estimation of minimal data sets sizes for machine learning ... [https://www.nature.com/articles/s41746-024-01360-w]
- 112. A refined approach for evaluating small datasets via binary ... [https://pmc.ncbi.nlm.nih.gov/articles/PMC11108166/]
- 113. Performance Metrics in Machine Learning [Complete Guide] [https://neptune.ai/blog/performance-metrics-in-machine-learning-complete-guide]
- 114. Performance Evaluation of Linear and Nonlinear Models ... [https://www.mdpi.com/2076-3417/11/20/9441]
- 115. Overfitting, Underfitting and General Model Overconfidence ... [https://www.ncbi.nlm.nih.gov/books/NBK610560/]
- 116. Quantifying Overfitting: Introducing the Overfitting Index [https://arxiv.org/abs/2308.08682]
- 117. Overfitting the validation set - machine learning [https://stats.stackexchange.com/questions/438651/overfitting-the-validation-set]
- 118. Interpretability Methods in Machine Learning: A Brief Survey [https://www.twosigma.com/articles/interpretability-methods-in-machine-learning-a-brief-survey/]
- 119. Partial Dependence and Individual Conditional ... [https://scikit-learn.org/stable/auto_examples/inspection/plot_partial_dependence.html]
- 120. Practical guide to SHAP analysis: Explaining supervised machine learning model predictions in drug development - PMC [https://pmc.ncbi.nlm.nih.gov/articles/PMC11513550/]
- 121. An introduction to explainable AI with Shapley values — SHAP latest ... [https://shap.readthedocs.io/en/latest/example_notebooks/overviews/An%20introduction%20to%20explainable%20AI%20with%20Shapley%20values.html]
- 122. GitHub - shap/shap: A game theoretic approach to explain the output of any machine learning model. [https://github.com/shap/shap]
- 123. AI in Drug Discovery: The Role of SHAP in Pharmacology [https://www.reprocell.com/blog/biopta/ai-in-drug-discovery-the-role-of-shap-in-pharmacology]
- 124. Interpretable Machine Learning Approaches for ... [https://aaqr.org/articles/aaqr-23-06-oa-0151]